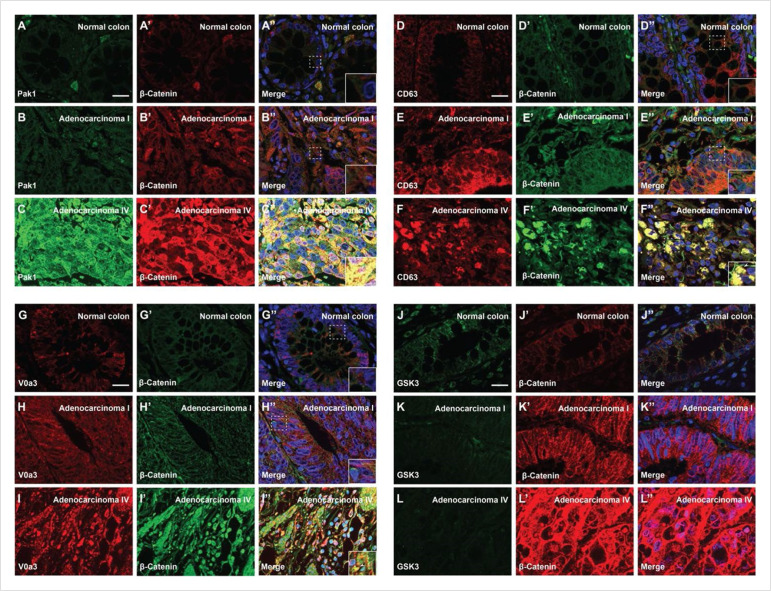
Figure 5. Degree of human colorectal cancer (CRC) malignancy is associated with increased macropinocytosis/multivesicular body (MVB)/lysosome markers and decreased GSK3 levels.
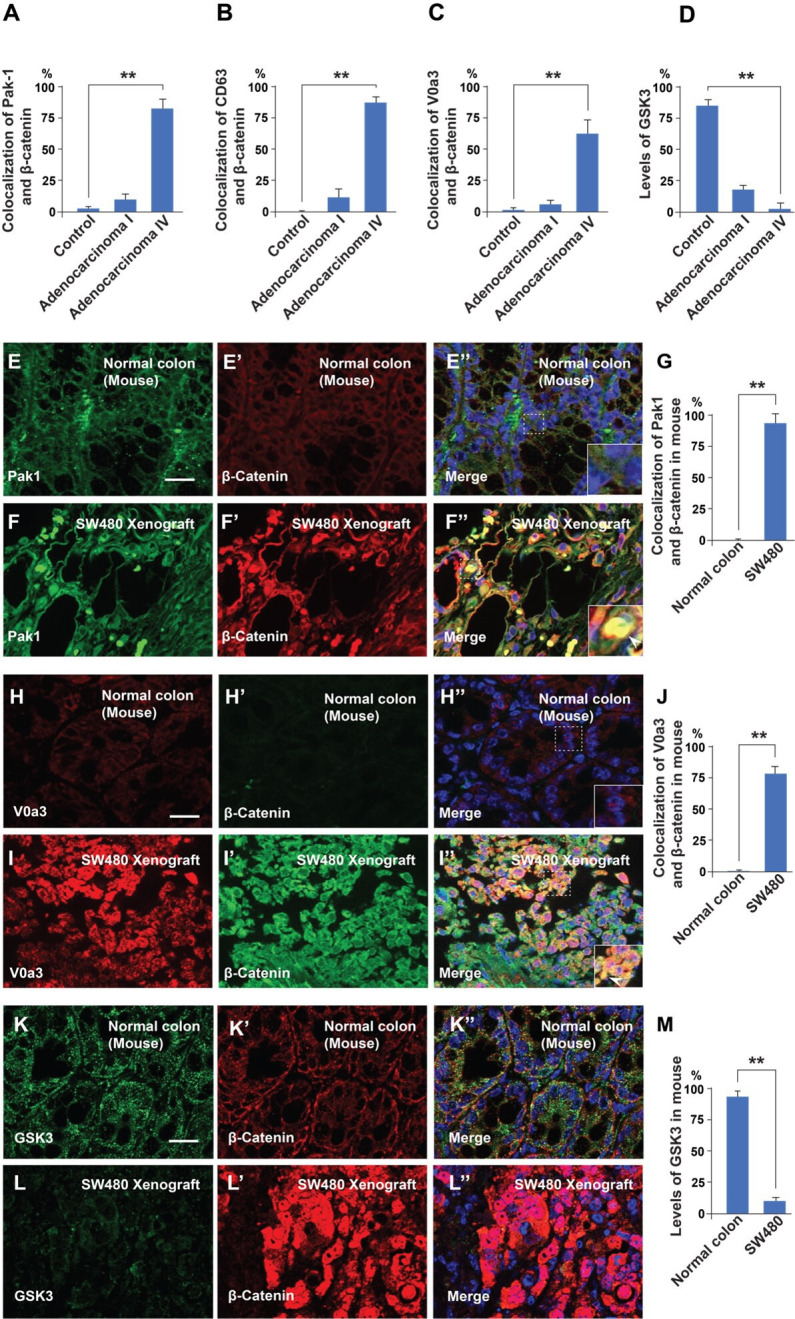
(A–A’) Normal human colon paraffin section stained with the macropinocytosis marker Pak1 and β-catenin, respectively.(A’’) Merged image with DAPI (4’,6-diamidino-2-phenylindole), a few cells colocalize both markers. (B–B’’) Pak1 and β-catenin levels are moderately increased at an early stage I CRC adenocarcinoma. (C’–C’’) Strong colocalization between Pak1 and β-catenin was observed in advanced stage IV CRC (inset). (D–D’’) Normal human colon section stained with the MVB marker CD63 and β-catenin; colocalization was not observed. (E–E’’) CD63 and β-catenin were stabilized in adenocarcinoma I, and moderate colocalization was found between CD63 and β-catenin. (F–F’) CD63 and β-catenin were strongly stabilized and colocalized in adenocarcinoma stage IV CRC. (F’’) Merge; note the striking colocalization between the MVB marker CD63 and β-catenin in advanced stages of cancer (inset). (G–G’’) Normal colon stained for V0a3 (a subunit of V-ATPase that marks lysosomes) and β-catenin. (H–H’’) Stage I adenocarcinoma with moderately increased levels of lysosomes and β-catenin. (I–I’’) Strong co-localization of lysosomes and β-catenin in stage IV CRC (see inset). (J–J’’) Human colon array stained with the GSK3 and β-catenin. (K–K’’) GSK3 decreases, and β-catenin increases, at early stages of carcinogenesis, (L–L’’) GSK3 levels are very low in advanced CRC compared to normal human colon, while β-catenin levels are very high. Scale bars, 10 μm. Also see Figure 5—figure supplement 1 for quantifications and mouse xenografts of CRC cell.
Figure 5—figure supplement 1. Malignancy of colorectal cancer positively correlates with macropinocytosis, multivesicular body (MVB), and lysosome markers, and inversely correlates with GSK3 levels.


