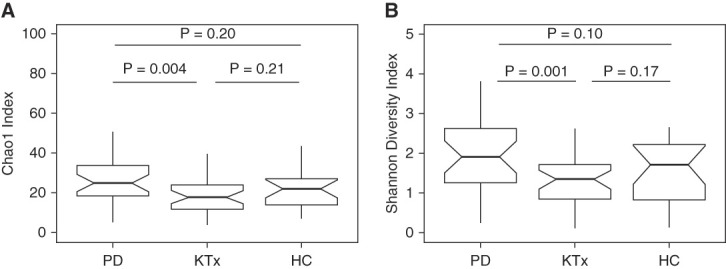
Figure 1.

Distinct differences in Nasal Microbial Diversity among the study cohort. (A) Box and whisker plots of Chao1 index, the estimated number of ASVs, in the anterior nasal specimens from the PD cohort, the KTx cohort, and the living donor/HC cohort. The Chao1 index is on the y axis, and the study group is on the x axis. P value shown was calculated using the Wilcoxon rank-sum test. (B) Box and whisker plots of Shannon diversity index, a measure of evenness and richness, in the anterior nasal specimens from the three cohorts. The Shannon diversity index is on the y axis, and the study group is on the x axis. P values shown were calculated using the Wilcoxon rank-sum test. ASV, amplicon sequence variant; HC, healthy control; KTx, kidney transplant; PD, peritoneal dialysis.
