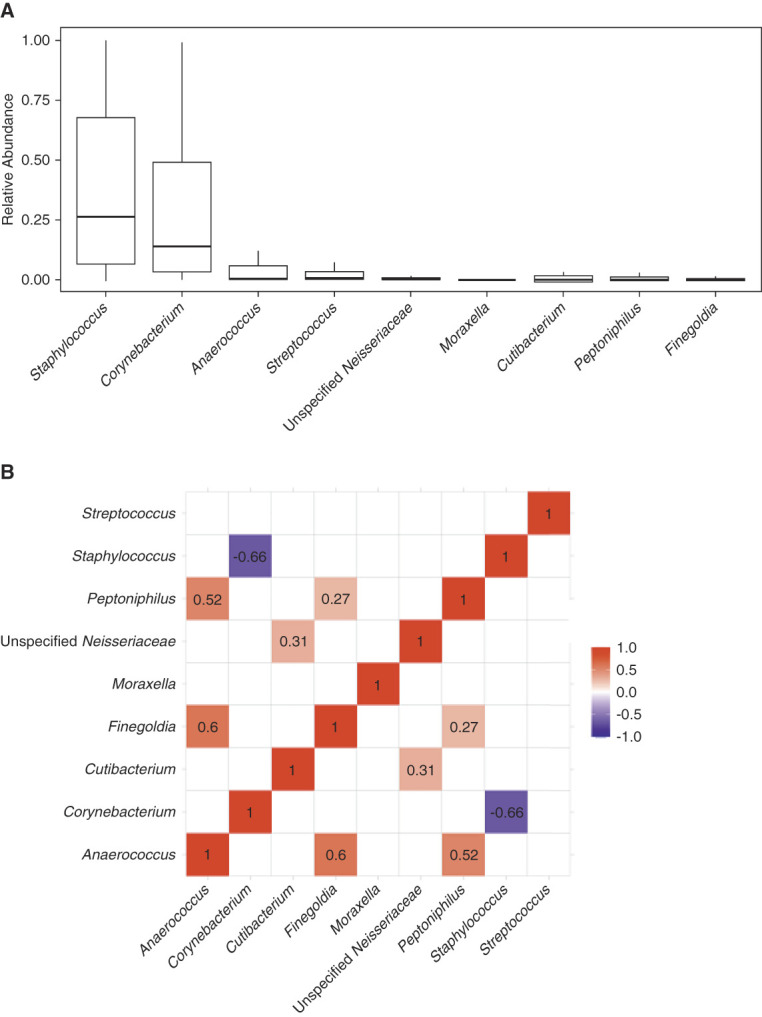
Figure 2.

Significant correlations among the most common genera in the study cohort. (A) The most common genera in the anterior nasal microbiota (>1% mean relative abundance in the cohort). Box and whisker plots are represented to show the variation in the relative abundance of the genus (y axis) with the genus on the x axis. (B) A correlational matrix between the nasal abundance of the most common genera using Pearson r correlations with Benjamini–Hochberg adjustment for multiple hypotheses. The numbers shown are Pearson r correlations that had an adjusted P value <0.10. The color shows the strength of the correlation with red showing a positive correlation between two genera and blue showing a negative correlation between two genera.
