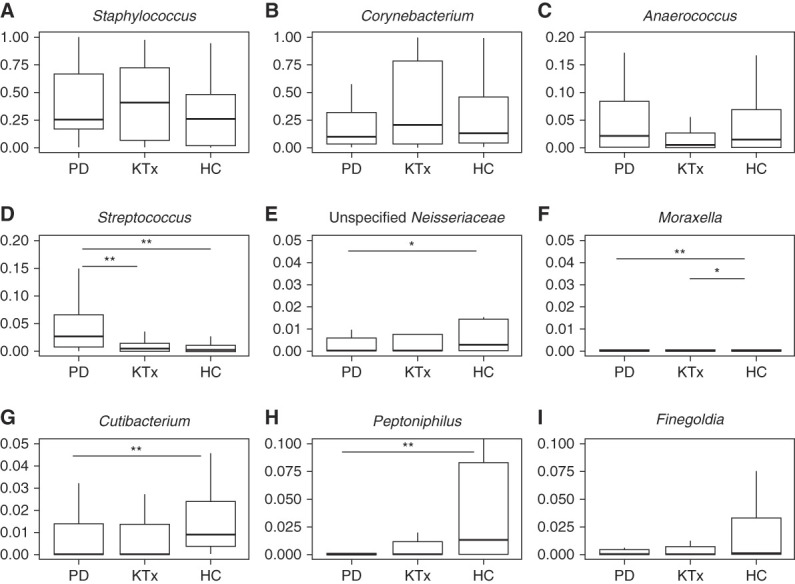
Figure 4.

Distinct microbial differences among the cohort at the genus level. Box and whisker plots are represented with the relative abundance of individual genera on the y axis and the group on the x axis. PD cohort (n=32). KTx cohort (n=37). Living donor/HC cohort (n=22). P values were calculated using the Wilcoxon rank-sum test with Benjamini–Hochberg adjustment for multiple hypotheses. **Adjusted P value <0.05. *Adjusted P value <0.10. (A) Staphylococcus analysis. (B) Corynebacterium analysis. (C) Anaerococcus analysis. (D) Streptococcus analysis. (E) Unspecified Neisseriaceae analysis. (F) Moraxella analysis. (G) Cutibacterium analysis. (H) Peptoniphilus analysis. (I) Finegoldia analysis. HC, healthy control; KTx, kidney transplant; PD, peritoneal dialysis.
