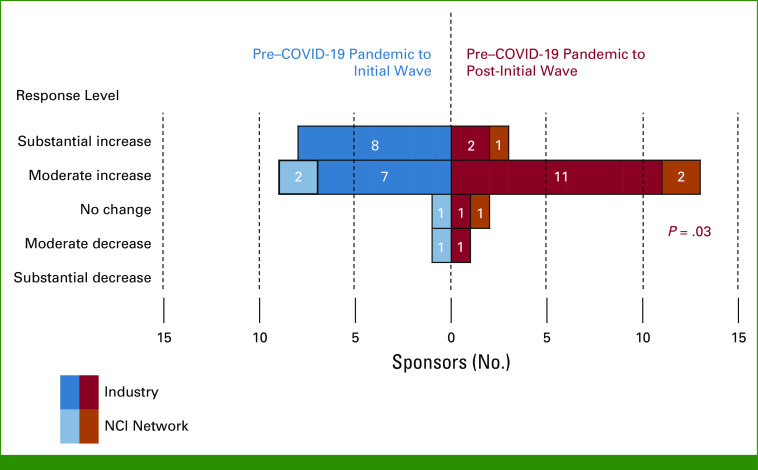
FIG 1.
Change in volume of protocol deviations compared with the pre-pandemic period (N = 19; industry = 15, NCI Network groups = 4). The horizontal bars indicate the number of sponsors indicating the level of change in volume of protocol deviations between the initial wave versus the pre–COVID-19 pandemic period (in blue) and between the post-initial wave versus the pre–COVID-19 pandemic period (in red). NCI, National Cancer Institute.

