
Figure 3.
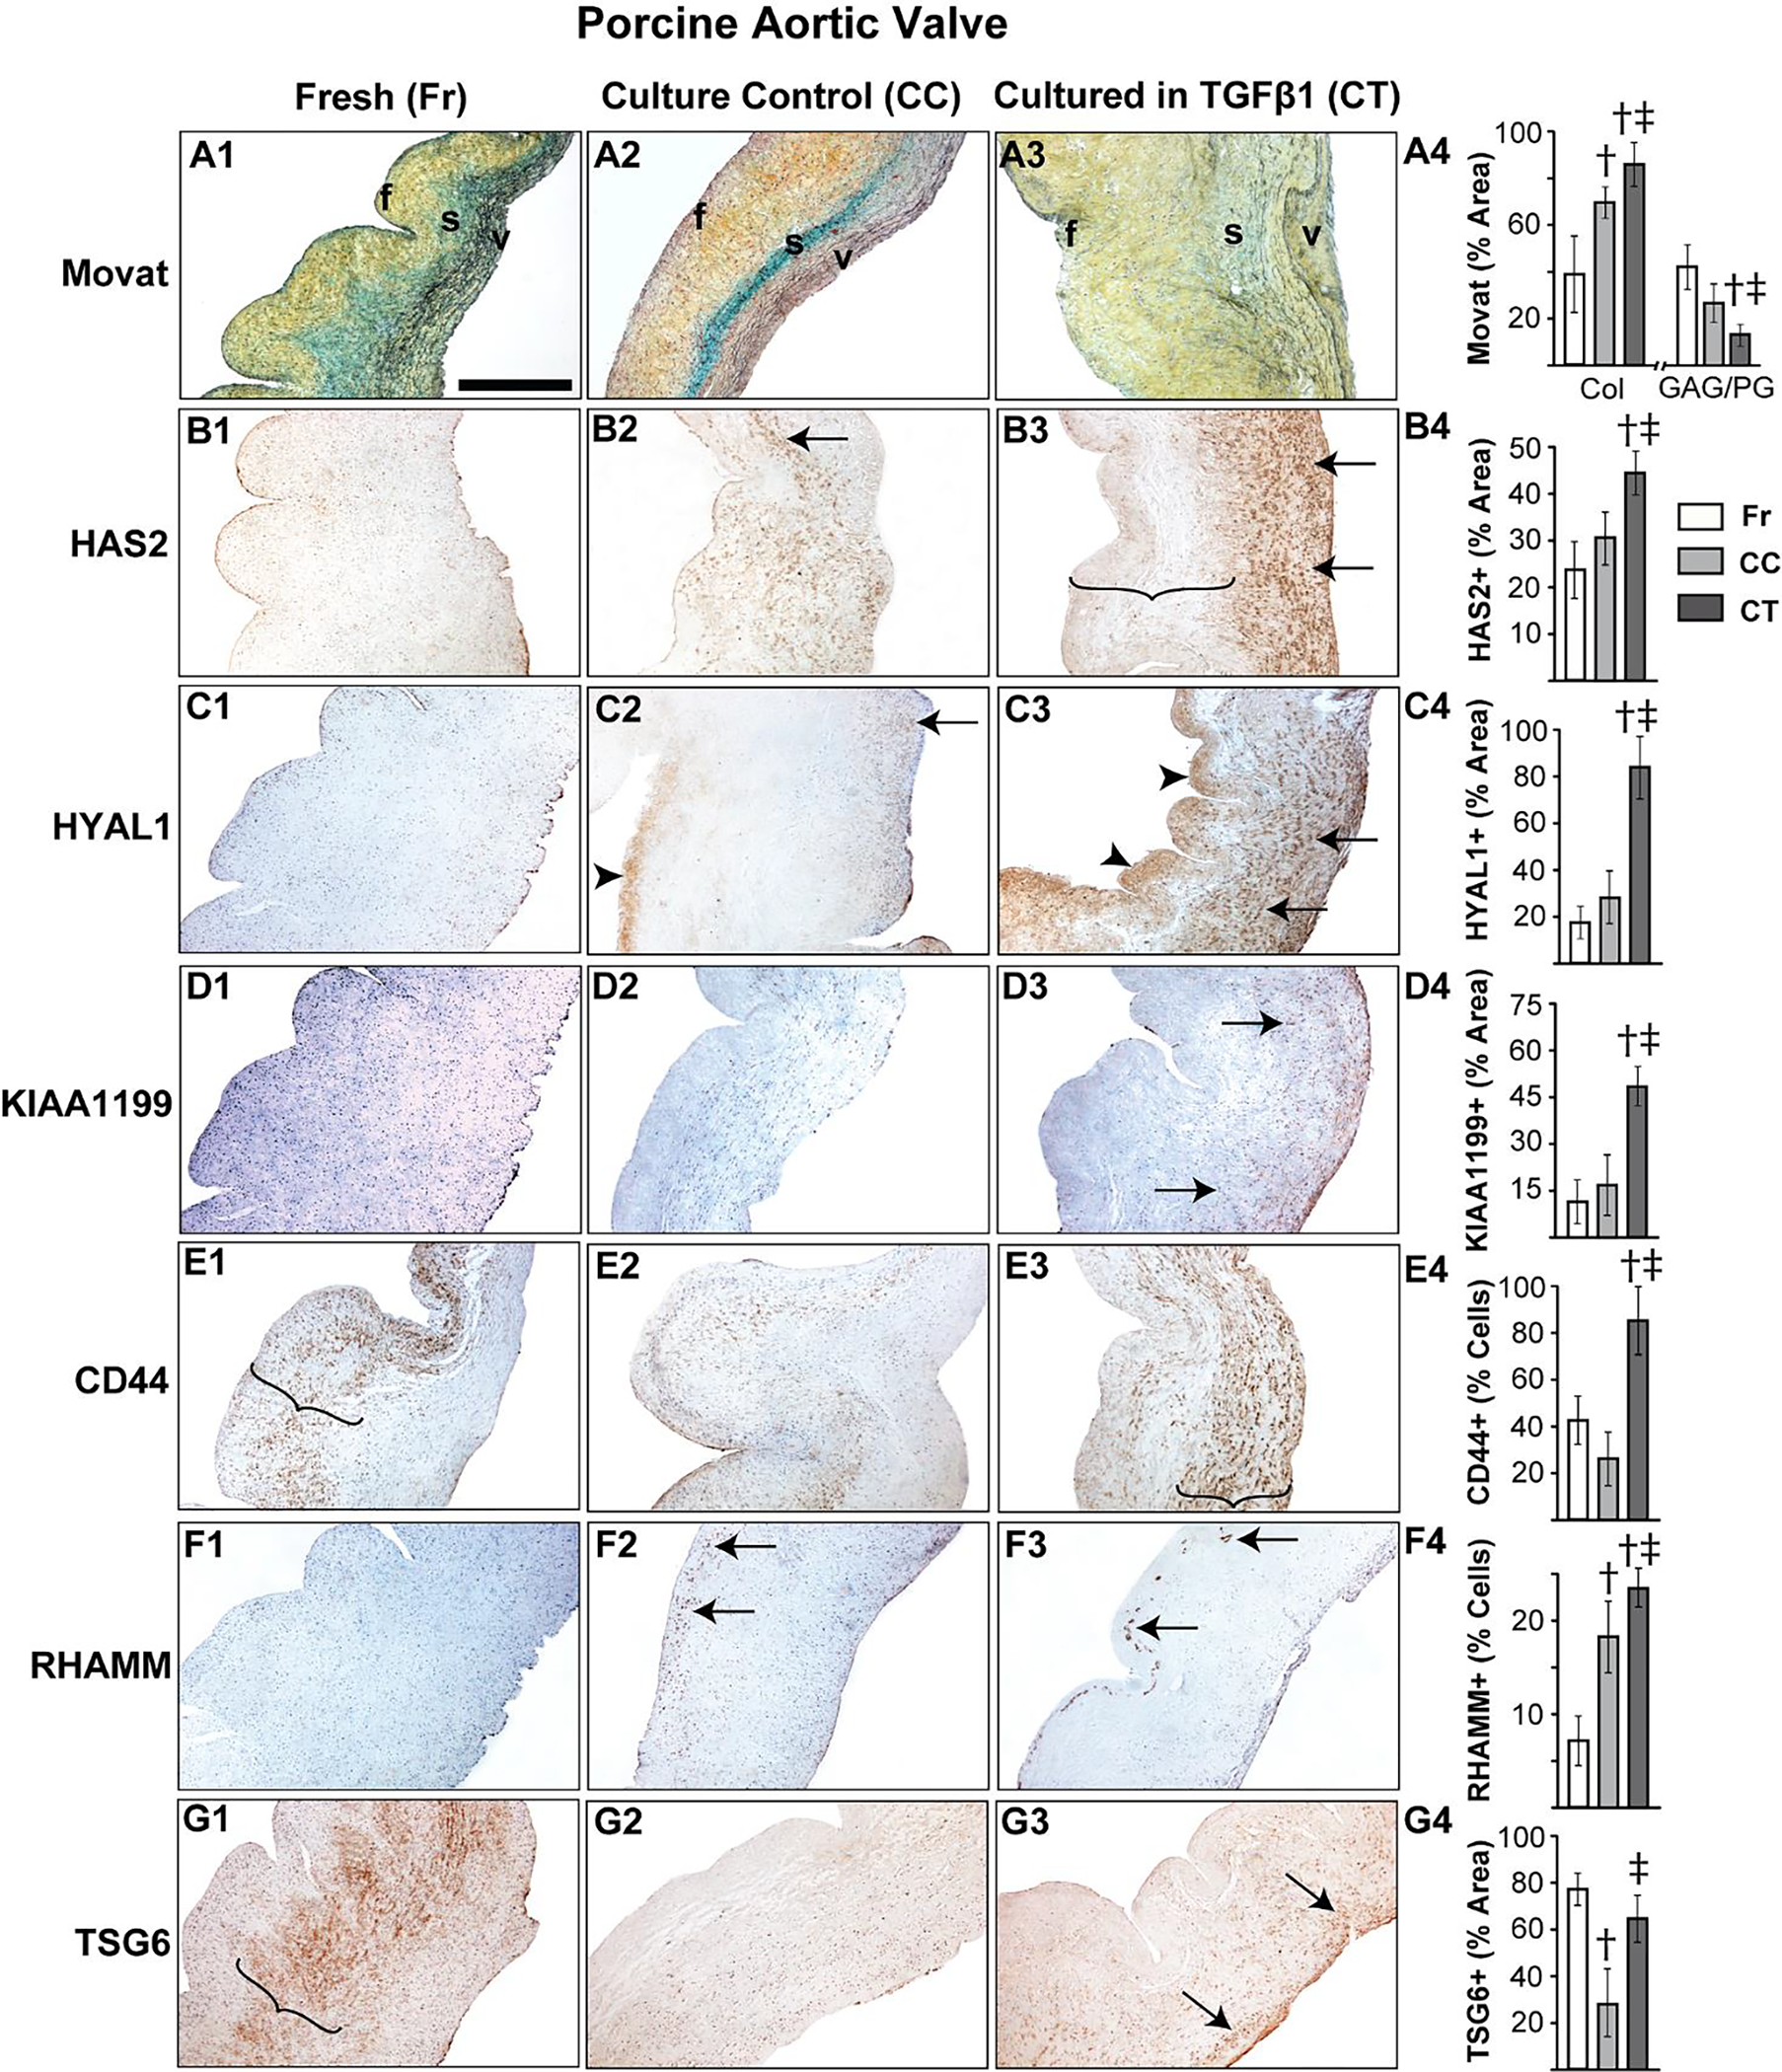
TGFβ1 causes aberrant regulation of HA homeostasis in porcine aortic valve tissue. Movat histochemical staining (A1–4) and expression patterns of HAS2 (B1–4), HYAL1 (C1–4), KIAA1199 (D1–4), CD44 (E1–4), RHAMM (F1–4) and TSG6 (G1–4) in valves classified as fresh, culture control or cultured in TGFβ1 are shown. Arrows and arrowheads denote cell and ECM expression respectively. Parenthesis mark the regions of expression. †: vs fresh p<0.05; ‡: vs culture control p<0.05. f, fibrosa; s, spongiosa; v, ventricularis. The orientation provided by the use of f, s, v in panels A-D apply to all the microscopic image panels in this figure. Scale bar: 200 μm.