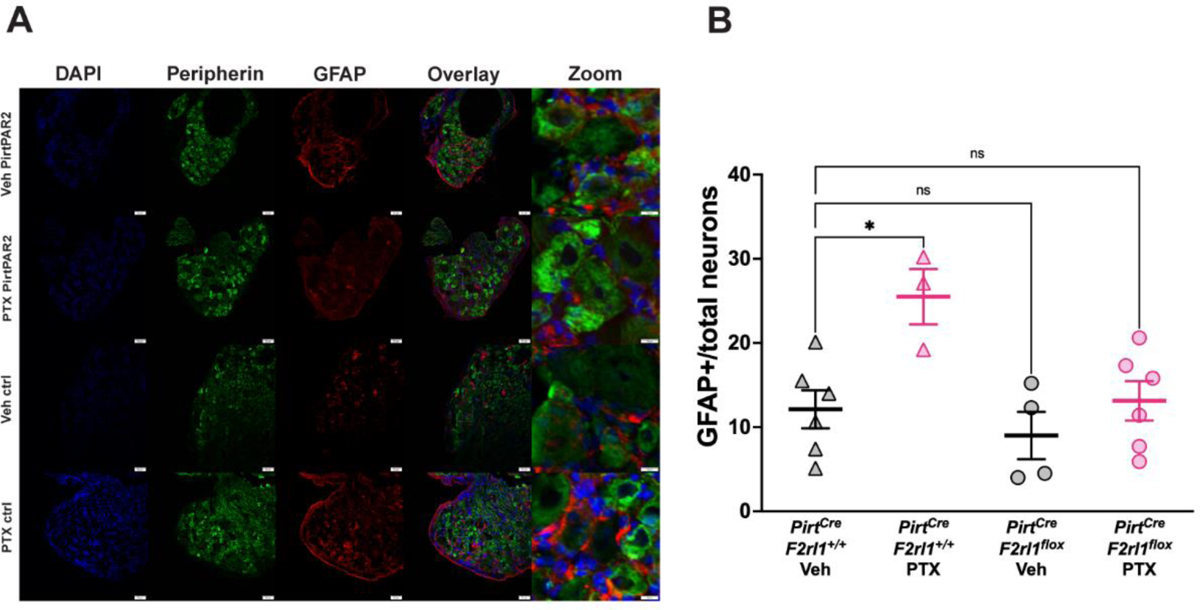
Figure 4: PirtCreF2rl1flox mice are protected from satellite gliosis as a result of paclitaxel treatment.

(A) Dorsal root ganglion (DRG) was dissected, cryosectioned at 20 μm, and stained for Peripherin (green) to visualize peripheral neurons, GFAP (red) to visualize satellite glial cells, and DAPI (blue) to visualize nuclei. The PirtCreF2rl1+/+ PTX mice show clear satellite cell gliosis as represented by an increase in GFAP expression in the DRG that is not seen in the PirtCreF2rl1flox PTX group or vehicle groups. (B) To determine the percentage of neurons that are surrounded by satellite glial cells, the number of neurons that were surrounded by 50% or more by GFAP-positive satellite glial cells was divided by the total number of neurons in the field of view. The PirtCreF2rl1+/+ PTX group showed significantly higher number of neurons surrounded by GFAP-positive satellite glial cells than the PirtCreF2rl1+/+ Veh group. Both PirtCreF2rl1flox groups were not significantly different from the PirtCreF2rl1+/+ Veh group. *p <0.05. For GFAP+/total neurons comparisons, one-way ANOVA with Dunnett’s multiple comparisons test was used. All group mean comparisons were made to the PirtCreF2rl1+/+ Veh group. Three sections per mouse were analyzed and averaged together. For the PirtCreF2rl1+/+ Veh group, n = 6 animals. For the PirtCreF2rl1+/+ PTX group, n = 3 animals. For the PirtCreF2rl1flox Veh group, n = 4 animals. For the PirtCreF2rl1flox PTX group, n = 6 animals.
