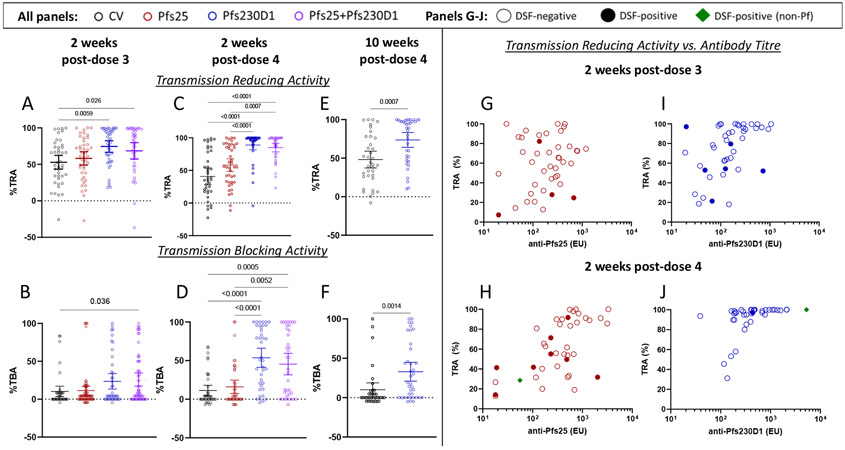
Figure 3. Pfs230D1 shows superior transmission reducing activity (TRA), transmission-blocking activity (TBA) and durability.
TBV functional activity was assessed by standard membrane feeding assay. Transmission reducing activity (TRA; Figures 3A, 3C, 3E) was defined as ((mean oocyst count in control sera – mean oocyst count in test sera)/mean oocyst count in control sera) x 100. Transmission blocking activity (TBA; Figures 3B, 3D, 3F) was defined as ((mean infection prevalence in assay control – mean prevalence in the test sample)/mean prevalence in the assay control) x 100. For 2 weeks post-each vaccination (post dose 3, Figures 3A, 3B; post dose 4: Figures 3C, 3D), differences between groups were analysed by Kruskal-Wallis test with Dunn’s correction for multiple comparisons; at 10 weeks post-dose 4 (Figures 3E, 3F), differences between Pfs230D1 group and comparator was analyzed by Mann-Whitney test. Significant p-values are presented. Transmission reducing plotted as a function of ELISA titre for Pfs25 and Pfs230D1 single antigen arms at 2 weeks post-dose 3 (Figures 3G, 3I), and 2 weeks post-dose 4 (Figure 3H, 3J). Results for the Pfs25+Pfs230D1 combination arm are presented in Figure S12, Appendix, page 67. Results for transmission reducing activity at 10 weeks post dose 4 for Pfs230D1 single antigen arm can be found in Figure S13, Appendix, page 68. Empty circles represent participants with negative DSF results; closed circles indicate participants with positive DSF results; green diamonds indicate DSFs that were positive for a non-falciparum Plasmodium species detected by PCR analysis of a single midgut selected from the feed. Dotted horizontal lines represent no difference from assay control (non-immune sera).

