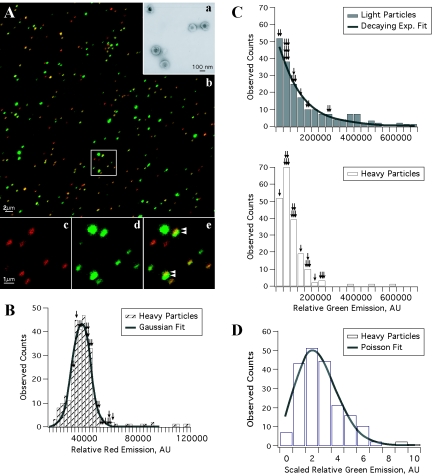
FIG. 4.
Visualization and quantitation of single fluorescent virion particles. (A) (a) Extracellular virions banded on a linear tartrate gradient (5 to 20%) are predominantly intact and monodispersed as demonstrated by electron microscopy of purified PRV 179 virions. (b) The fluorescence emission of PRV 181 particles isolated by a similar method were predominantly punctate and nonoverlapping. A higher-magnification view (b, inset) illustrates the heterogeneous fluorescence emission of the virus particles: the capsid fusion (c, red) is relatively constant, while the emission of the fluorescent tegument fusion (d, green) varies considerably from particle to particle. Heavy particles from the gradient (containing capsid) were identified by red fluorescence, while light particles (lacking capsid) were identified by the presence of green and the absence of red fluorescence. (e) At times, the red and green emissions of heavy particles appear juxtaposed or only partially overlapping (arrowheads). (B to D) Histogram plot of the green and red fluorescence emissions from 200 single heavy or light particles were quantitated. (B) The red fluorescence histogram plot of heavy particles is modeled by a Gaussian curve [χ2red = 1.47; df = 17; P(χ2) ≅ 0.09]. (C) The green fluorescence histogram plot of light particles was best fit by a decaying exponential (exp.) curve [χ2green = 0.966; df = 14; P(χ2) ≅ 0.5] with a mean of 1.44 × 10⁵ ± 0.1 × 10⁵ AU (top, gray bars). However, the green fluorescence of heavy particles was not modeled well by this curve and exhibited a mean fluorescence of 0.778 × 10⁵ ± 0.047 × 10⁵ AU, approximately half that of the mean of light particle distribution (bottom, white bars). (D) Rescaling of the green fluorescence of heavy particles (shown in panel C) by a constant factor allowed for a Poisson curve fit [χ2 = 5.055; df = 6; P(χ2) > 0.4]. See Materials and Methods for more information on the distribution analysis. The fluorescence emissions of axonal puncta (the fluorescent equivalent of 20 heavy or light particles in axons) from the infected neuron shown in Fig. 7B are overlaid on the histograms as black arrows (with one arrow per axonal particle).

