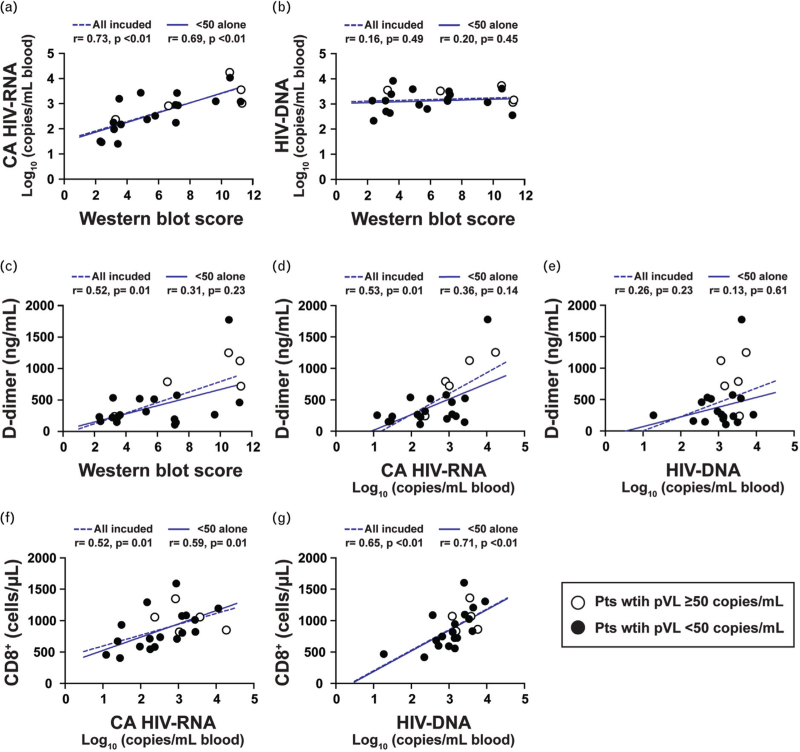
Fig. 3.
Associations between levels of HIV-1, western blot score, D-dimer, and T cells.
Associations between levels of: (a) WB (western blot) score and cell-associated (CA) HIV-RNA; (b) WB score and HIV-DNA; (c) WB score and D-dimer; (d) CA HIV-RNA and D-dimer; (e) HIV-DNA and D-dimer; (f) CA HIV-RNA and CD8+ T cells; and (g) HIV-DNA and CD8+ T cells for Pts 1–23. For Pts 21–23 (Longitudinal group), the time points from the last available sample during plasma HIV-RNA less than 50 copies/ml were used (Pt 21: 20.2 years.; Pt 22: 17.5 years.; Pt 23: 14.5 years). WB score from Pt 19 could not be obtained because of high background in the western blot assay and thus not included in (a–c). Open circles represent data derived from sampling time points with plasma HIV-RNA at least 50 copies/ml; filled circles represent data derived from time points during suppressive ART with plasma HIV-RNA less than 50 copies/ml. Spearman correlations were estimated separately for a group including all participants (dotted blue lines) and a group excluding the five individuals (Pts 1–5) with HIV-RNA at least 50 copies/ml (solid blue lines). The Spearman correlation coefficient (r) and P value are shown.

