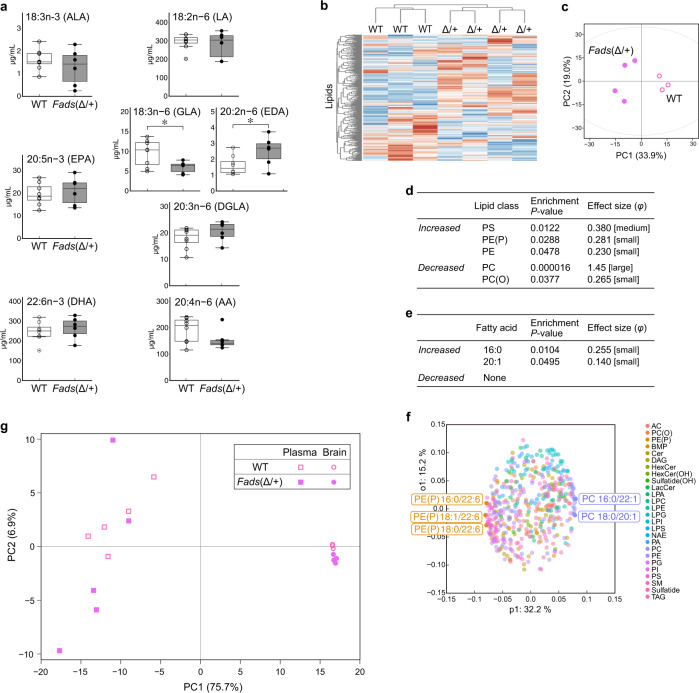
Fig. 2. Lipid analysis of male Fads(Δ/+) mice fed a normal chow diet.
a Plasma fatty acid levels in mice fed a normal chow diet. The intermediate metabolites GLA and EDA significantly differed between WT (n = 8) and Fads(Δ/+) (n = 6) mice (*P < 0.05, d = 0.658 [medium ES] and 0.272 [small ES], respectively, t-test with Bonferroni correction). Note that the values on the vertical axis are very different in each graph. For the boxplot description, see the legend of Fig. 1c. b Dendrogram of unsupervised clustering analysis of 464 brain lipids in mice fed a normal chow diet. c PCA plot of mice based on brain lipids. This is a part of Fig. 4b. PC1 and PC2 were calculated using all brain lipidomics data from males in this study (Fig. 4b and Supplementary Fig. 9). d, e Lipid class (d) and fatty acid (e) enrichment analysis of differentially changed brain lipids between Fads(Δ/+) and WT mice. Enrichment P-values are given by Fisher’s exact test. The abbreviations for the lipid classes are listed in Supplementary Table 4. f OPLS-DA loading plot of the 464 brain lipids from Fads(Δ/+) and WT mice. The top 1% of lipid molecules are highlighted. The comparisons between genotypes for these individual lipids are shown in Supplementary Fig. 7. g PCA plot of brain and plasma samples based on 282 lipids that were detected all the brain and plasma samples.

