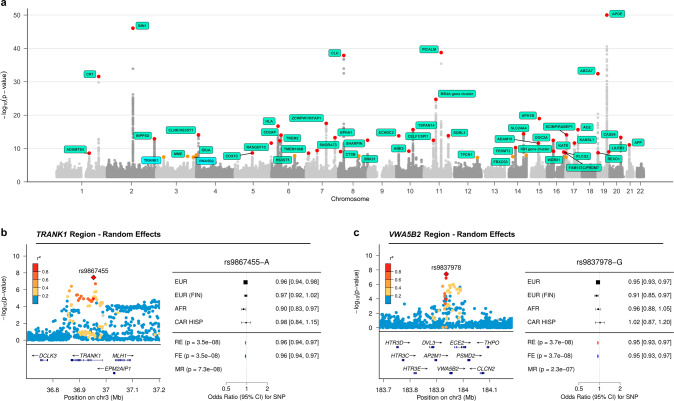
Fig. 2. Summary of multi-ancestry meta-analysis.
a The Manhattan plot for the random effects meta-analysis P values, truncated at −log10(P) < 50. An orange dot indicates that the lead SNP at a locus reached a P value < 5 × 10⁻⁸, while a red dot indicates a P value < 5 × 10⁻⁹. b, c The corresponding local association plots for the two loci of interest and forest plots summarizing the effect estimates per ancestry group for lead SNPs at the two loci of interest. Lead SNPs from both novel loci were absent in the East Asian dataset by Shigemizu et al. used for discovery. Abbreviations - MR MR-MEGA, RE Random effects, FE Fixed effect, EUR European, EUR (FIN) Finnish European, AFR African American, CAR HISP Caribbean Hispanic.

