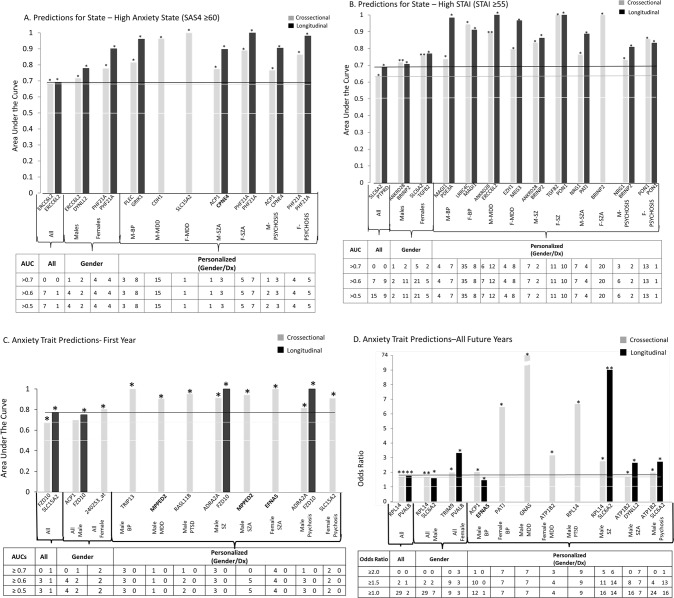
Fig. 2. Best Single Biomarkers Predictors for Anxiety, State and Trait.
From top candidate biomarkers after Steps 1–3 (Discovery, Prioritization, Validation-Bold) (n = 95). Bar graph shows best predictive biomarkers in each group. All markers with * are nominally significant p < 0.05. Table underneath the figures displays the actual number of biomarkers for each group whose ROC AUC p values (A–C) and Cox Odds Ratio p values (D) are at least nominally significant. Some gender and diagnosis groups are missing from the graph as they did not have any significant biomarkers or that the cohort was too small with limited data for the z-scoring by gender-dx. Cross-sectional is based on levels at one visit. Longitudinal is based on levels at multiple visits (integrates levels at most recent visit, maximum levels, slope into most recent visit, and maximum slope). Dividing lines represent the cutoffs for a test performing at chance levels (white), and at the same level as the best biomarkers for all subjects in cross-sectional (gray) and longitudinal (black) based predictions. Biomarkers perform better than chance. Biomarkers performed better when personalized by gender and diagnosis. * nominally significant. ** survived Bonferroni correction for the number of candidate biomarkers tested.

