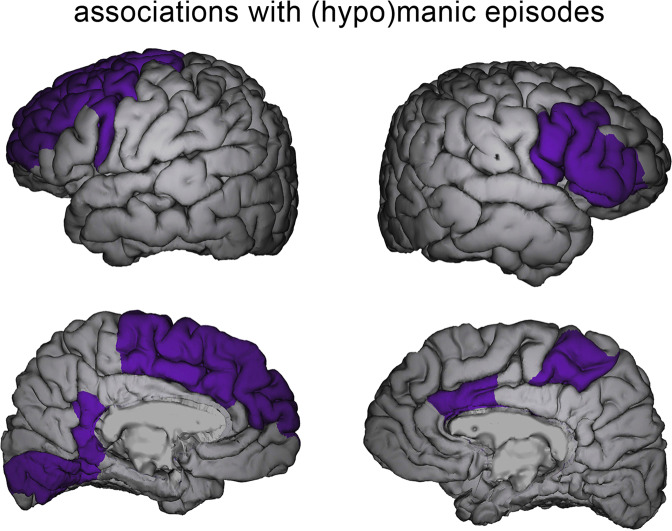
Fig. 1. Associations between longitudinal cortical thickness changes and (hypo)manic episodes.
Figure obtained from Abé et al. [21] showing anatomical locations of brain regions in which negative correlations between thickness change rates and the number of (hypo)manic episodes between imaging timepoints were observed in the ENIGMA-BD study [21]. The brain areas identified in the ENIGMA-BD study largely cover regions identified in this review (see Table 1 for details).

