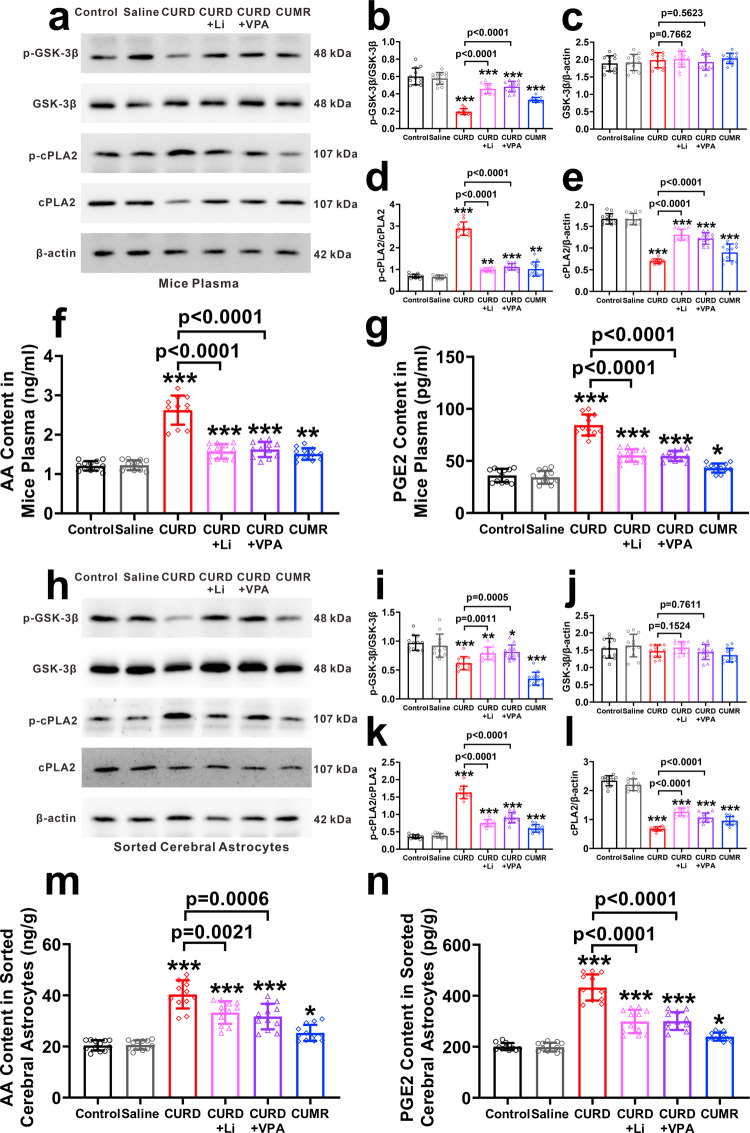
Fig. 6. Molecular indicators in the plasma of model mice and cerebral astrocytes.
a–e Representative protein bands of p-GSK3β, GSK3β, p-cPLA2, cPLA2, and β-actin from the plasma of model mice, and the grey values of protein bands normalised to β-actin. f, g The levels of AA and PGE2 in the plasma of model mice. g The levels of AA in the plasma of model mice. h–l Representative protein bands of p-GSK3β, GSK3β, p-cPLA2, cPLA2, and β-actin from the sorted astrocytes of Aldh1l1-EGFP, and the grey values of protein bands normalised to β-actin. m, n Levels of AA and PGE2 in cortical astrocytes. Data were presented as mean ± SD, n = 12 per group. One-way ANOVA for comparisons including more than two groups; unpaired two-tailed t-test for two group comparisons. Significant different from control group: *p < 0.05, **p < 0.01 and ***p < 0.001.

