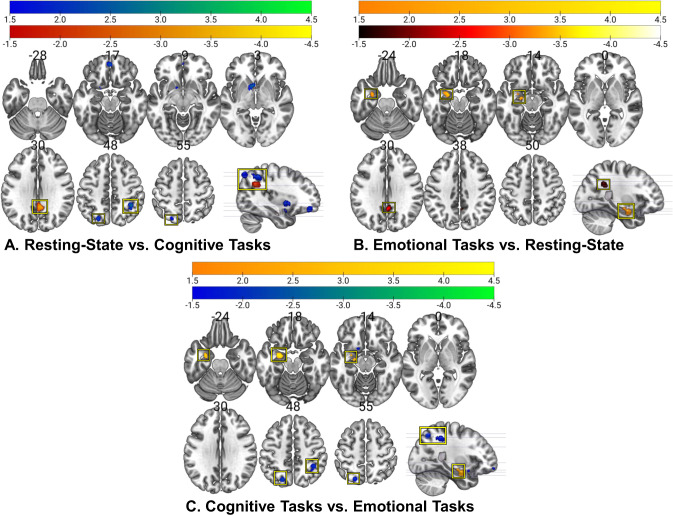
Fig. 4. Contrast maps of activation distinguishing BD from controls (pFWE < .05) for specific task types.
Activations displayed in the sagittal slices reflect the position in the y/z axis. A Resting-state > cognitive clusters are shown in orange (slice 30) and red (sagittal slice); cognitive > resting-state clusters are shown in blue. B Resting-state > emotional clusters are shown in red (slice 30) and burgundy (sagittal slice); emotional > resting-state clusters are shown in yellow. C Emotional > cognitive clusters are shown in yellow; cognitive > emotional clusters are shown in blue.

