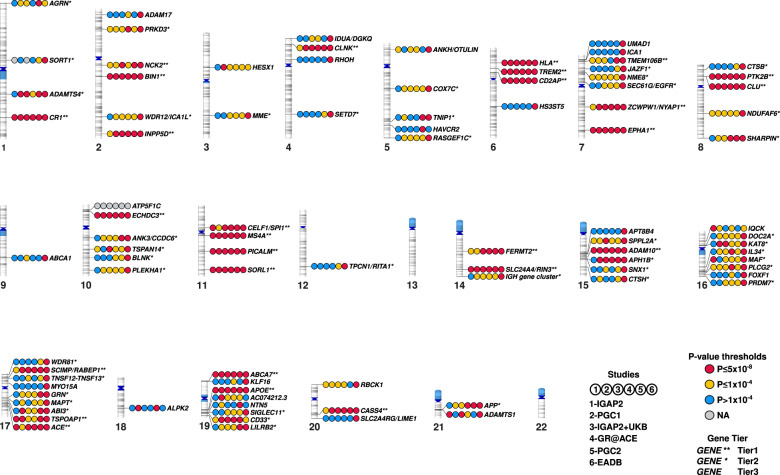
Fig. 1. Ideogram of the 90 loci with genome-wide significance extracted from the GWAS catalog and classified as tier 1, tier 2 or tier 3.
For each locus, the figure shows the P-value categories for the association with AD in the six main GWASs published since 2019 (IGAP2, PGC1, IGAP2 + UKB, GR@ACE, PGC2, and EADB, [20–23, 26, 27]): P ≤ 5 × 10⁻⁸, P ≤ 1 × 10⁻⁴, P > 1 × 10⁻⁴, or NA (not available). See the additional note for details of the methods.

