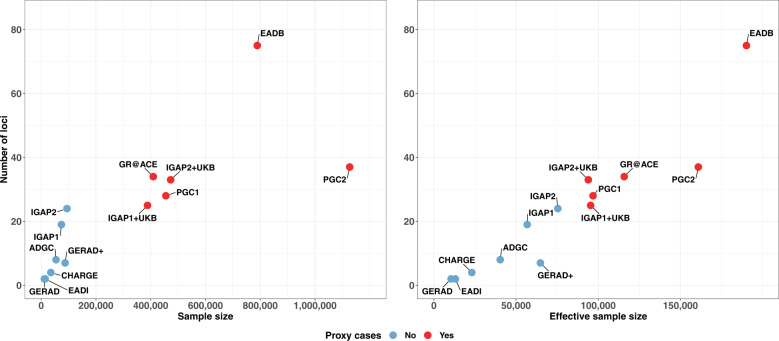
Fig. 2. Number of loci identified in the different GWASs.
Number of loci identified as a function of the sample size (left) or the effective sample size (right) (cases and controls) in the main GWASs published since 2009 (EADI, GERAD, CHARGE, GERAD+, ADGC, IGAP1, IGAP1 + UKB (2017), IGAP1 + UKB (2018), PGC1, IGAP2, IGAP2 + UKB, GR@ACE, PGC2, and EADB [14–27]. The colors indicate the presence or absence of proxy cases in the GWAS. The effective sample size was computed per study included in the meta-analyses, and then summed across studies [124]. The effective sample size for the proxy UKB study was computed by dividing the raw number of proxy cases and proxy controls by four [24, 117].

