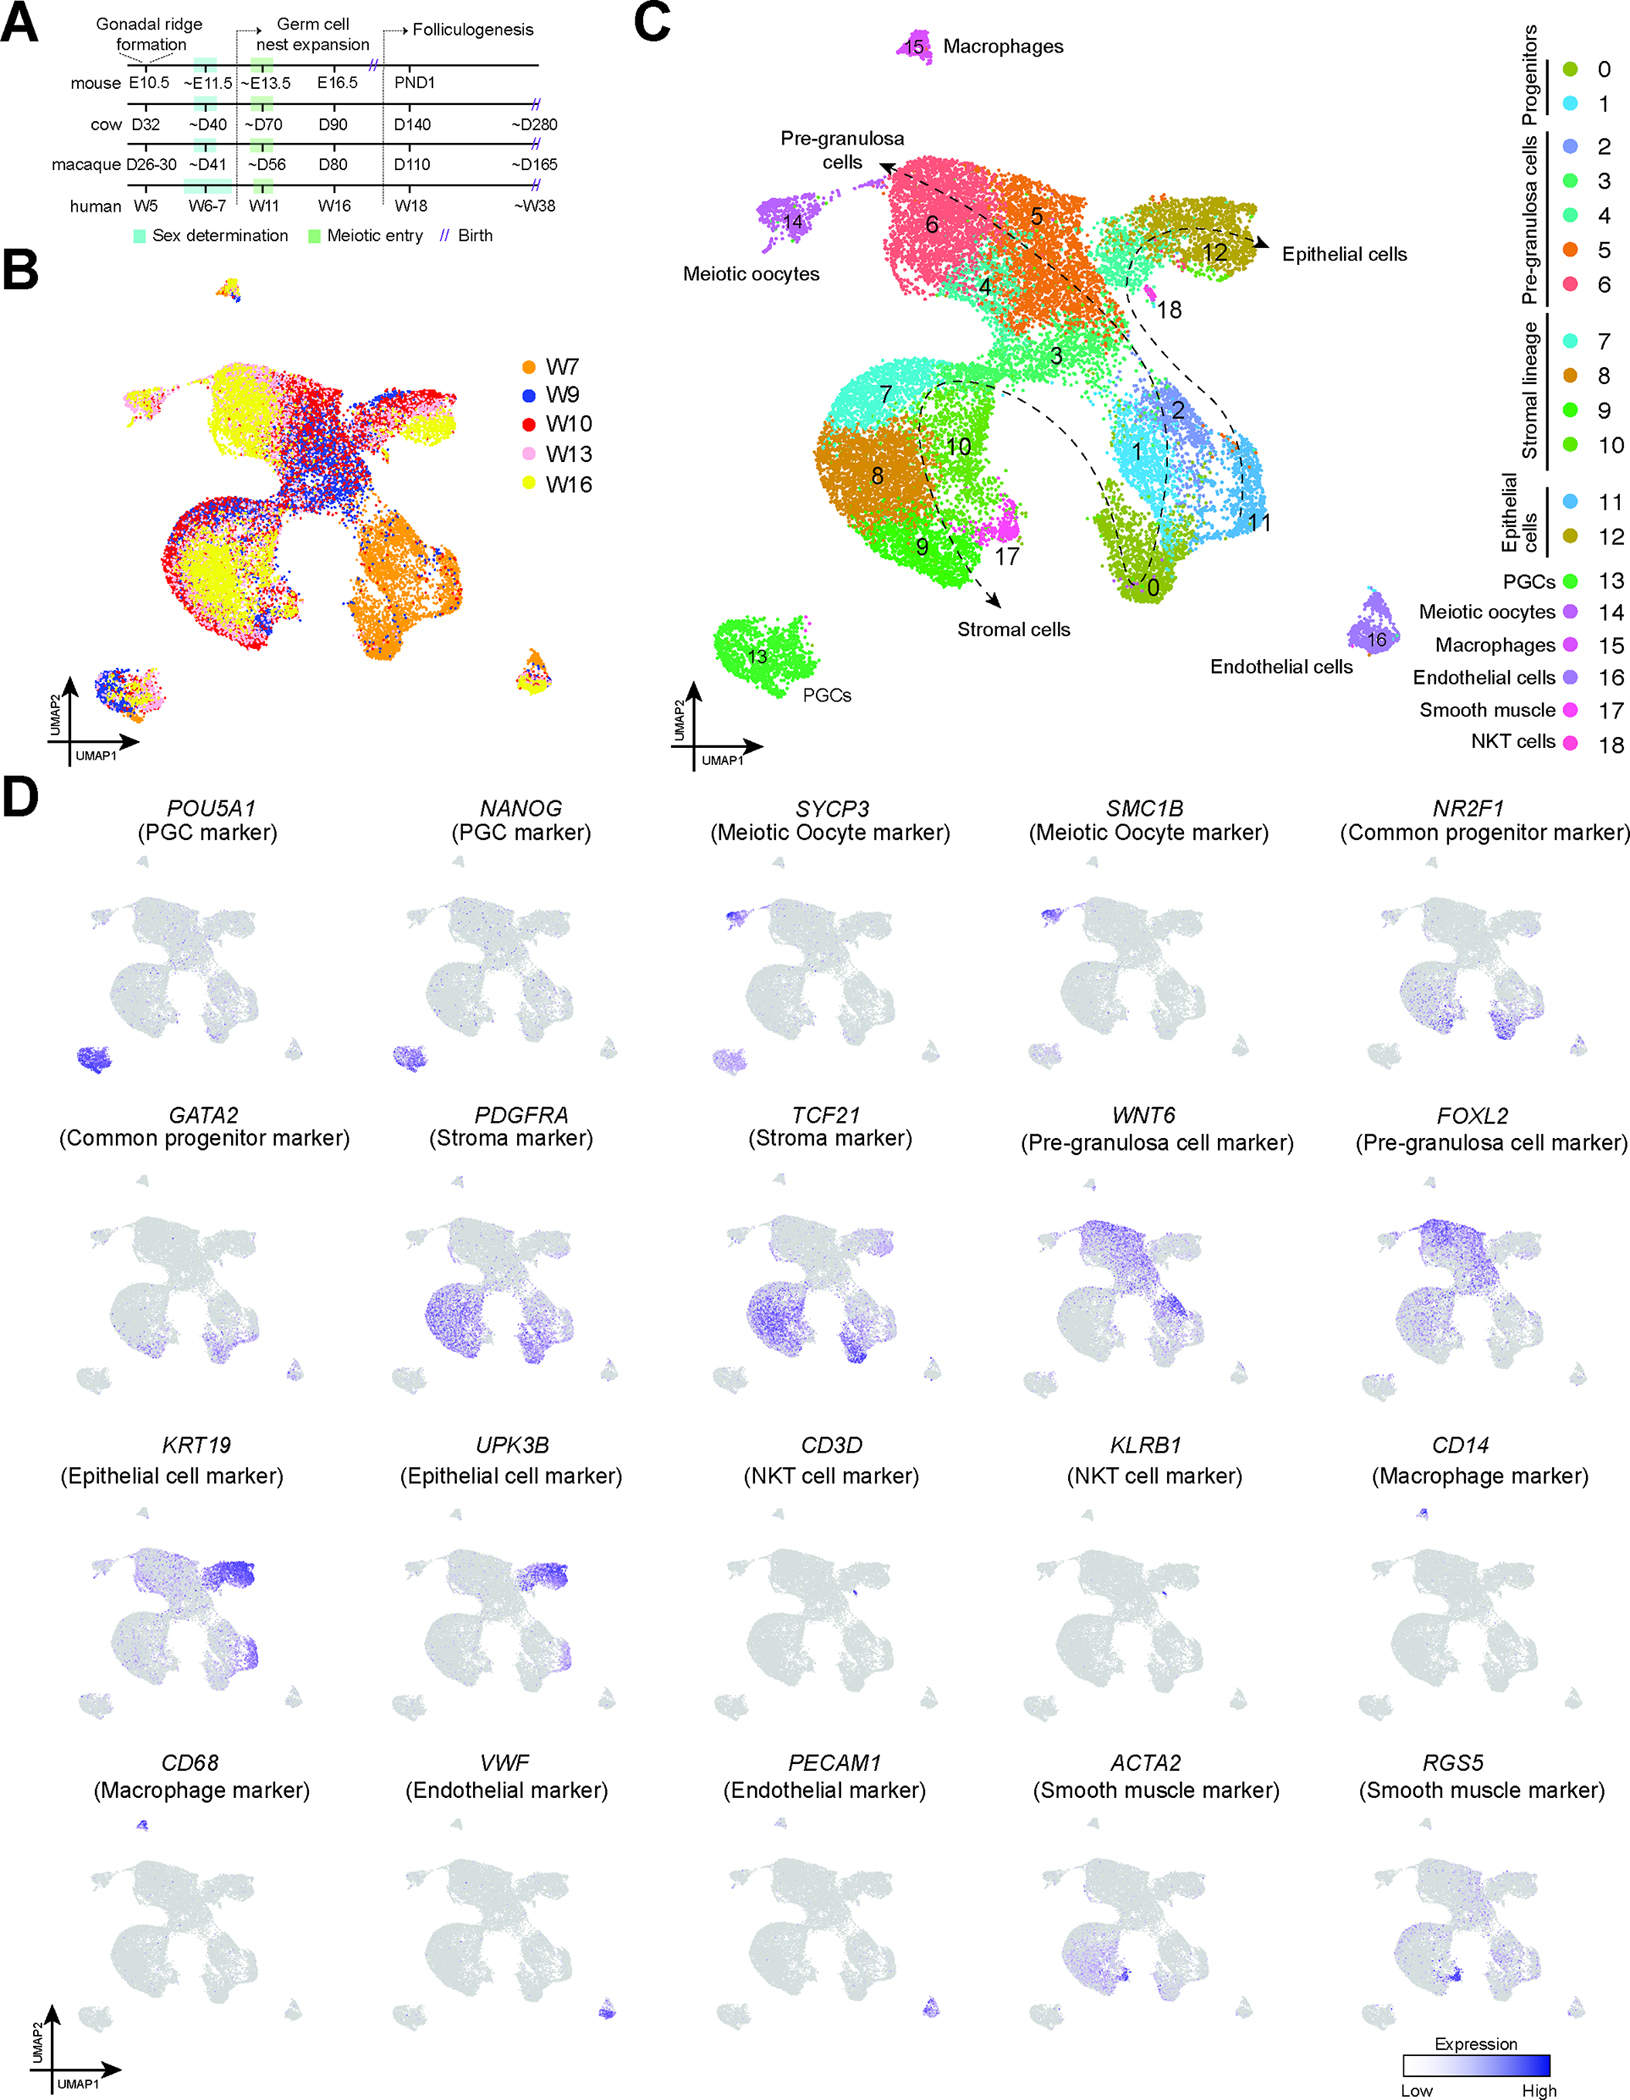
Figure 1: Single-cell transcriptome profile of ovarian cells from 7 to 16 weeks post-fertilization.

A: Illustration comparing the timing of selected ovarian development events identified in mouse, bovine, primate (rhesus or cynomolgus macaque) and human studies.
B: UMAP plot showing the distribution of single cells collected from fetal ovaries between 7 and 16 weeks of development (W7 – W16). Cells are colored based on their donor of origin.
C: UMAP plot from Fig 1A colored according to the cell types. The dashed lines show the lineage trajectory.
D: Expression of markers identifying major ovarian cell types cast on the UMAP plot from Fig 1A. Normalized expression is plotted on a high-to-low scale (purple-grey).
