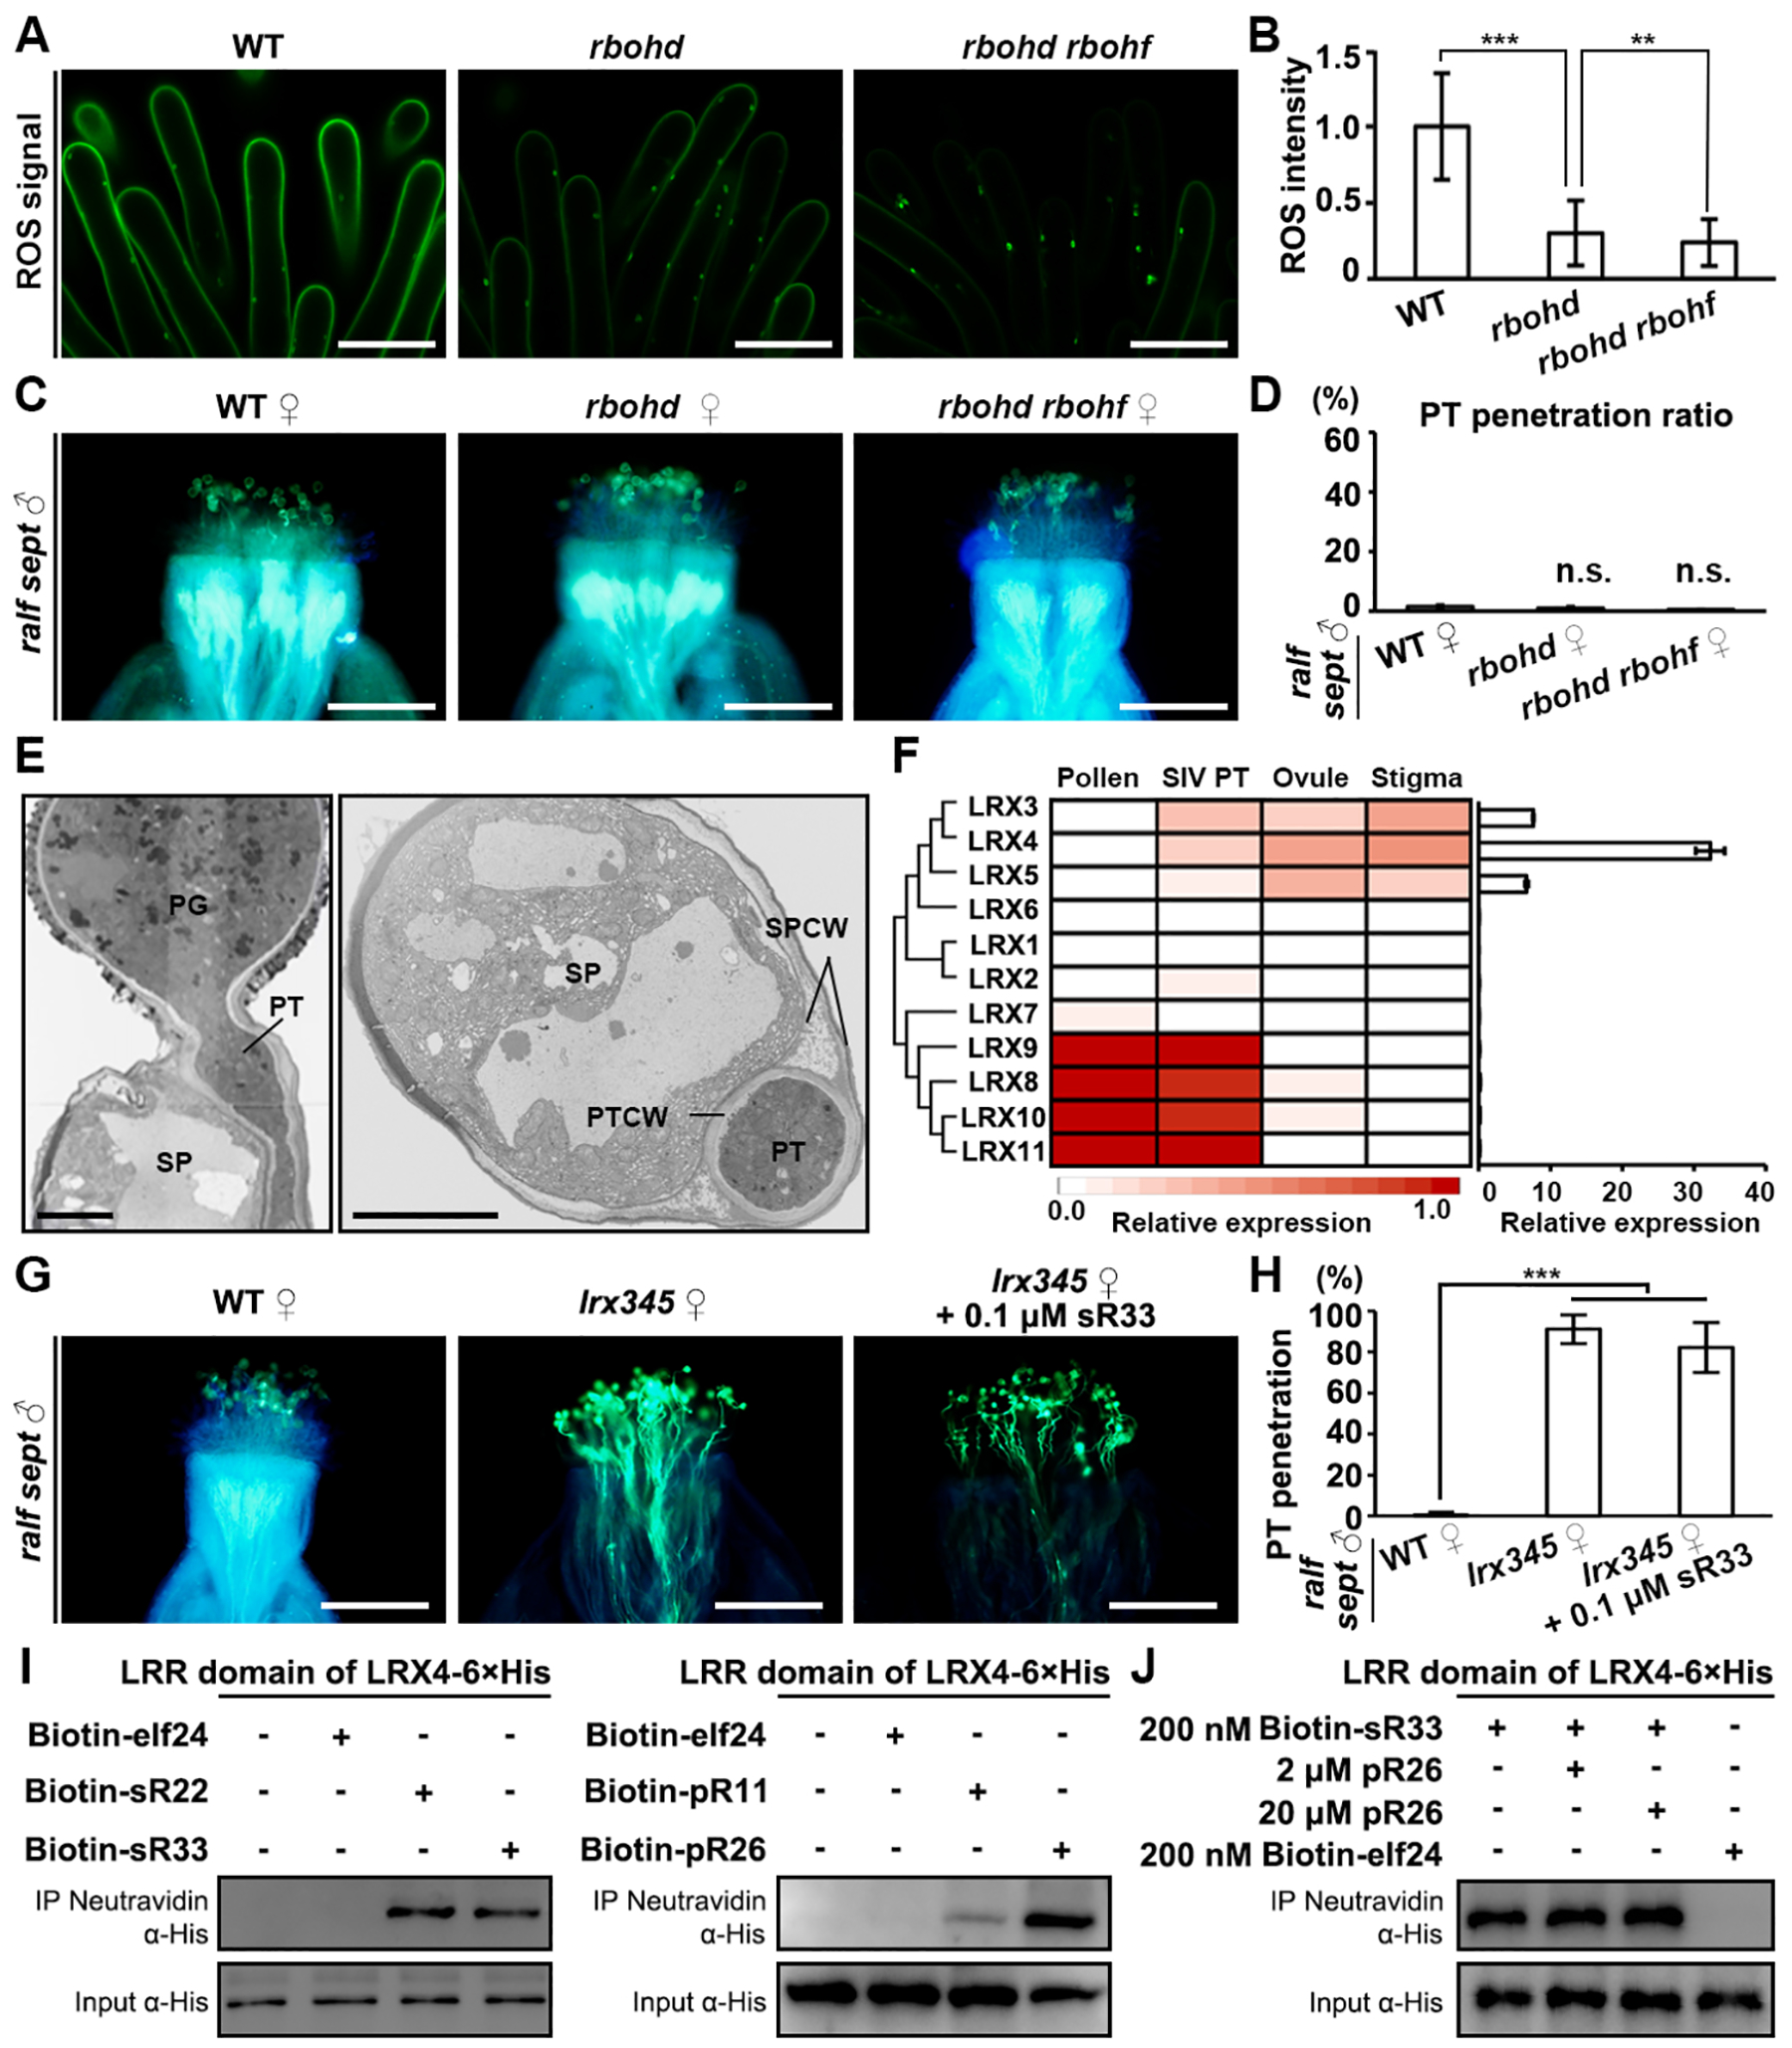
Figure 5. Cell-wall LRX proteins participate in the establishment of the stigmatic lock.

(A) H2DCF-DA staining shows ROS levels in unpollinated papilla cells of WT, rbohd and rbohd rbohf, respectively. Scale bars, 10 μm.
(B) Quantification of stigmatic ROS level shown in (A). Data are mean values ± SD; *** shows P<0.001, ** shows P<0.01 (Student’s t test).
(C) Aniline blue staining showing penetration status of ralf sept pollen tubes at 3 HAP in the stigmas of WT, rbohd and rbohd rbohf, respectively. Scale bars, 200 μm.
(D) Statistical analysis of the pollen tube penetration phenotype shown in (A). n.s., not significant, P>0.1 (Student’s t test).
(E) TEM images of a wild-type pollen tube penetrating a wild-type papilla cell (penetration occurs between the cell wall and the plasma membrane). Left, longitudinal section; Right, cross section. PG, pollen grain; PT, pollen tube; SP, stigma papilla; SPCW, stigma papilla cell wall; PTCW, pollen tube cell wall. Scale bar, 5 μm.
(F) Relative expression levels of each LRX gene in designated tissues. Left, heatmap; Right, real-time PCR results.
(G) Aniline blue staining showing penetration status of ralf sept pollen tubes at 3 HAP in the stigmas of WT, lrx345, and lrx345 pretreated with 0.1 μM synthetic sR33, respectively. Scale bars, 200 μm.
(H) Statistical analysis of the pollen tube penetration phenotype shown in (G). Data are mean values ± SD; *** shows P<0.001 (Student’s t test). All the assays were performed at least three times.
(I) Pull-down assays showing binding activities between 6×His-tagged LRR domain of LRX4 and biotinylated elf24 (negative control), sRALFs (22/33, left panel) and pRALFs (11/26, right panel), respectively.
(J) Competitive pull-down assays showing lack of changes in binding activities between sR33 with 6×His-tagged LRR domain of LRX4 in the presence of an increasing amount of pR26.
See also Figure S5.
