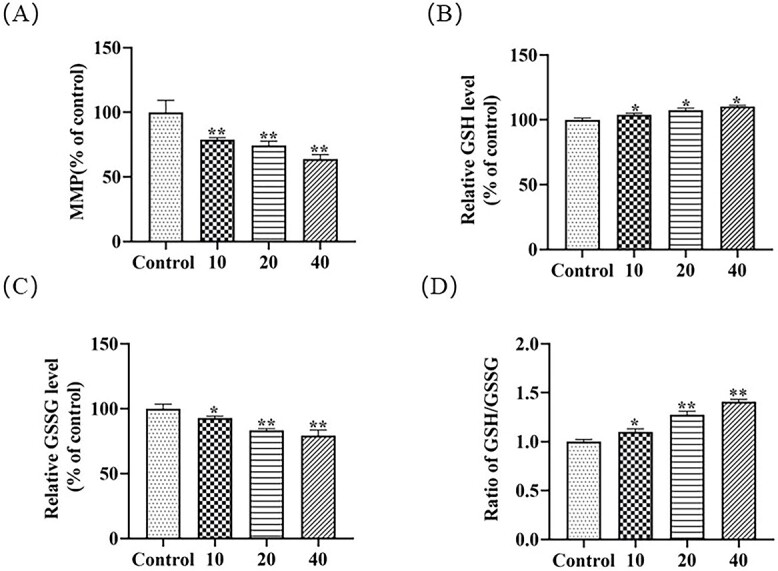
Fig. 2.

The oxidative stress response induced by MTCS exposure. L02 cells were exposed to MTCS (10, 20 and 40 μM) for 24 h. A): MMP measured by Rhodamine 123 fluorescent probe assay. B): Reduced glutathione (GSH) level and C): Oxidized glutathione (GSSG) level. D): The GSH/GSSG ratio. For control group, L02 cells were treated with DMSO/DMEM (0.1%, v/v) only. * p < 0.05, ** p < 0.01, vs. control group.
