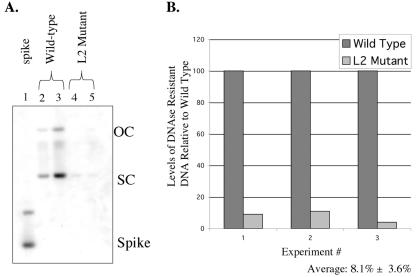
FIG. 5.
Virus particles lacking L2 contain less DNase-resistant DNA. (A) Representative Southern blot of DNase-resistant DNA obtained from virus preps harvested from rafts of NIKS harboring wild-type (lanes 2 and 3) or L2 mutant (lanes 4 and 5) genomes. Lane 1, bacterially synthesized plasmid DNA that was spiked into the preparations of virus prior to DNase treatment to evaluate the completeness of DNase digestion. Note the absence of spike DNA in lanes 2 to 5. (B) Bar graph providing the quantification of the relative levels of DNase-resistant viral DNA in virus preps from rafts harboring wild-type or L2 mutant HPV31a genomes. Results are provided for three independent experiments. In each experiment, DNA was quantified from phosphorimager analyses of Southern analyses (an example of which is shown in panel A), evaluating levels of DNase-resistant DNA in virus preps from rafts of one or more independent clonal NIKS populations harboring either wild-type (dark bars) or L2 mutant (light bars) HPV31a genomes. For each experiment, the average level of DNase-resistant DNA in virus preps for rafts harboring wild-type HPV31a genomes was set to 100. Based upon the values obtained in these three independent analyses, the average relative amount of DNase-resistant DNA in the L2 mutant virus preps was 8.1% of that observed in the wild-type virus preps.

