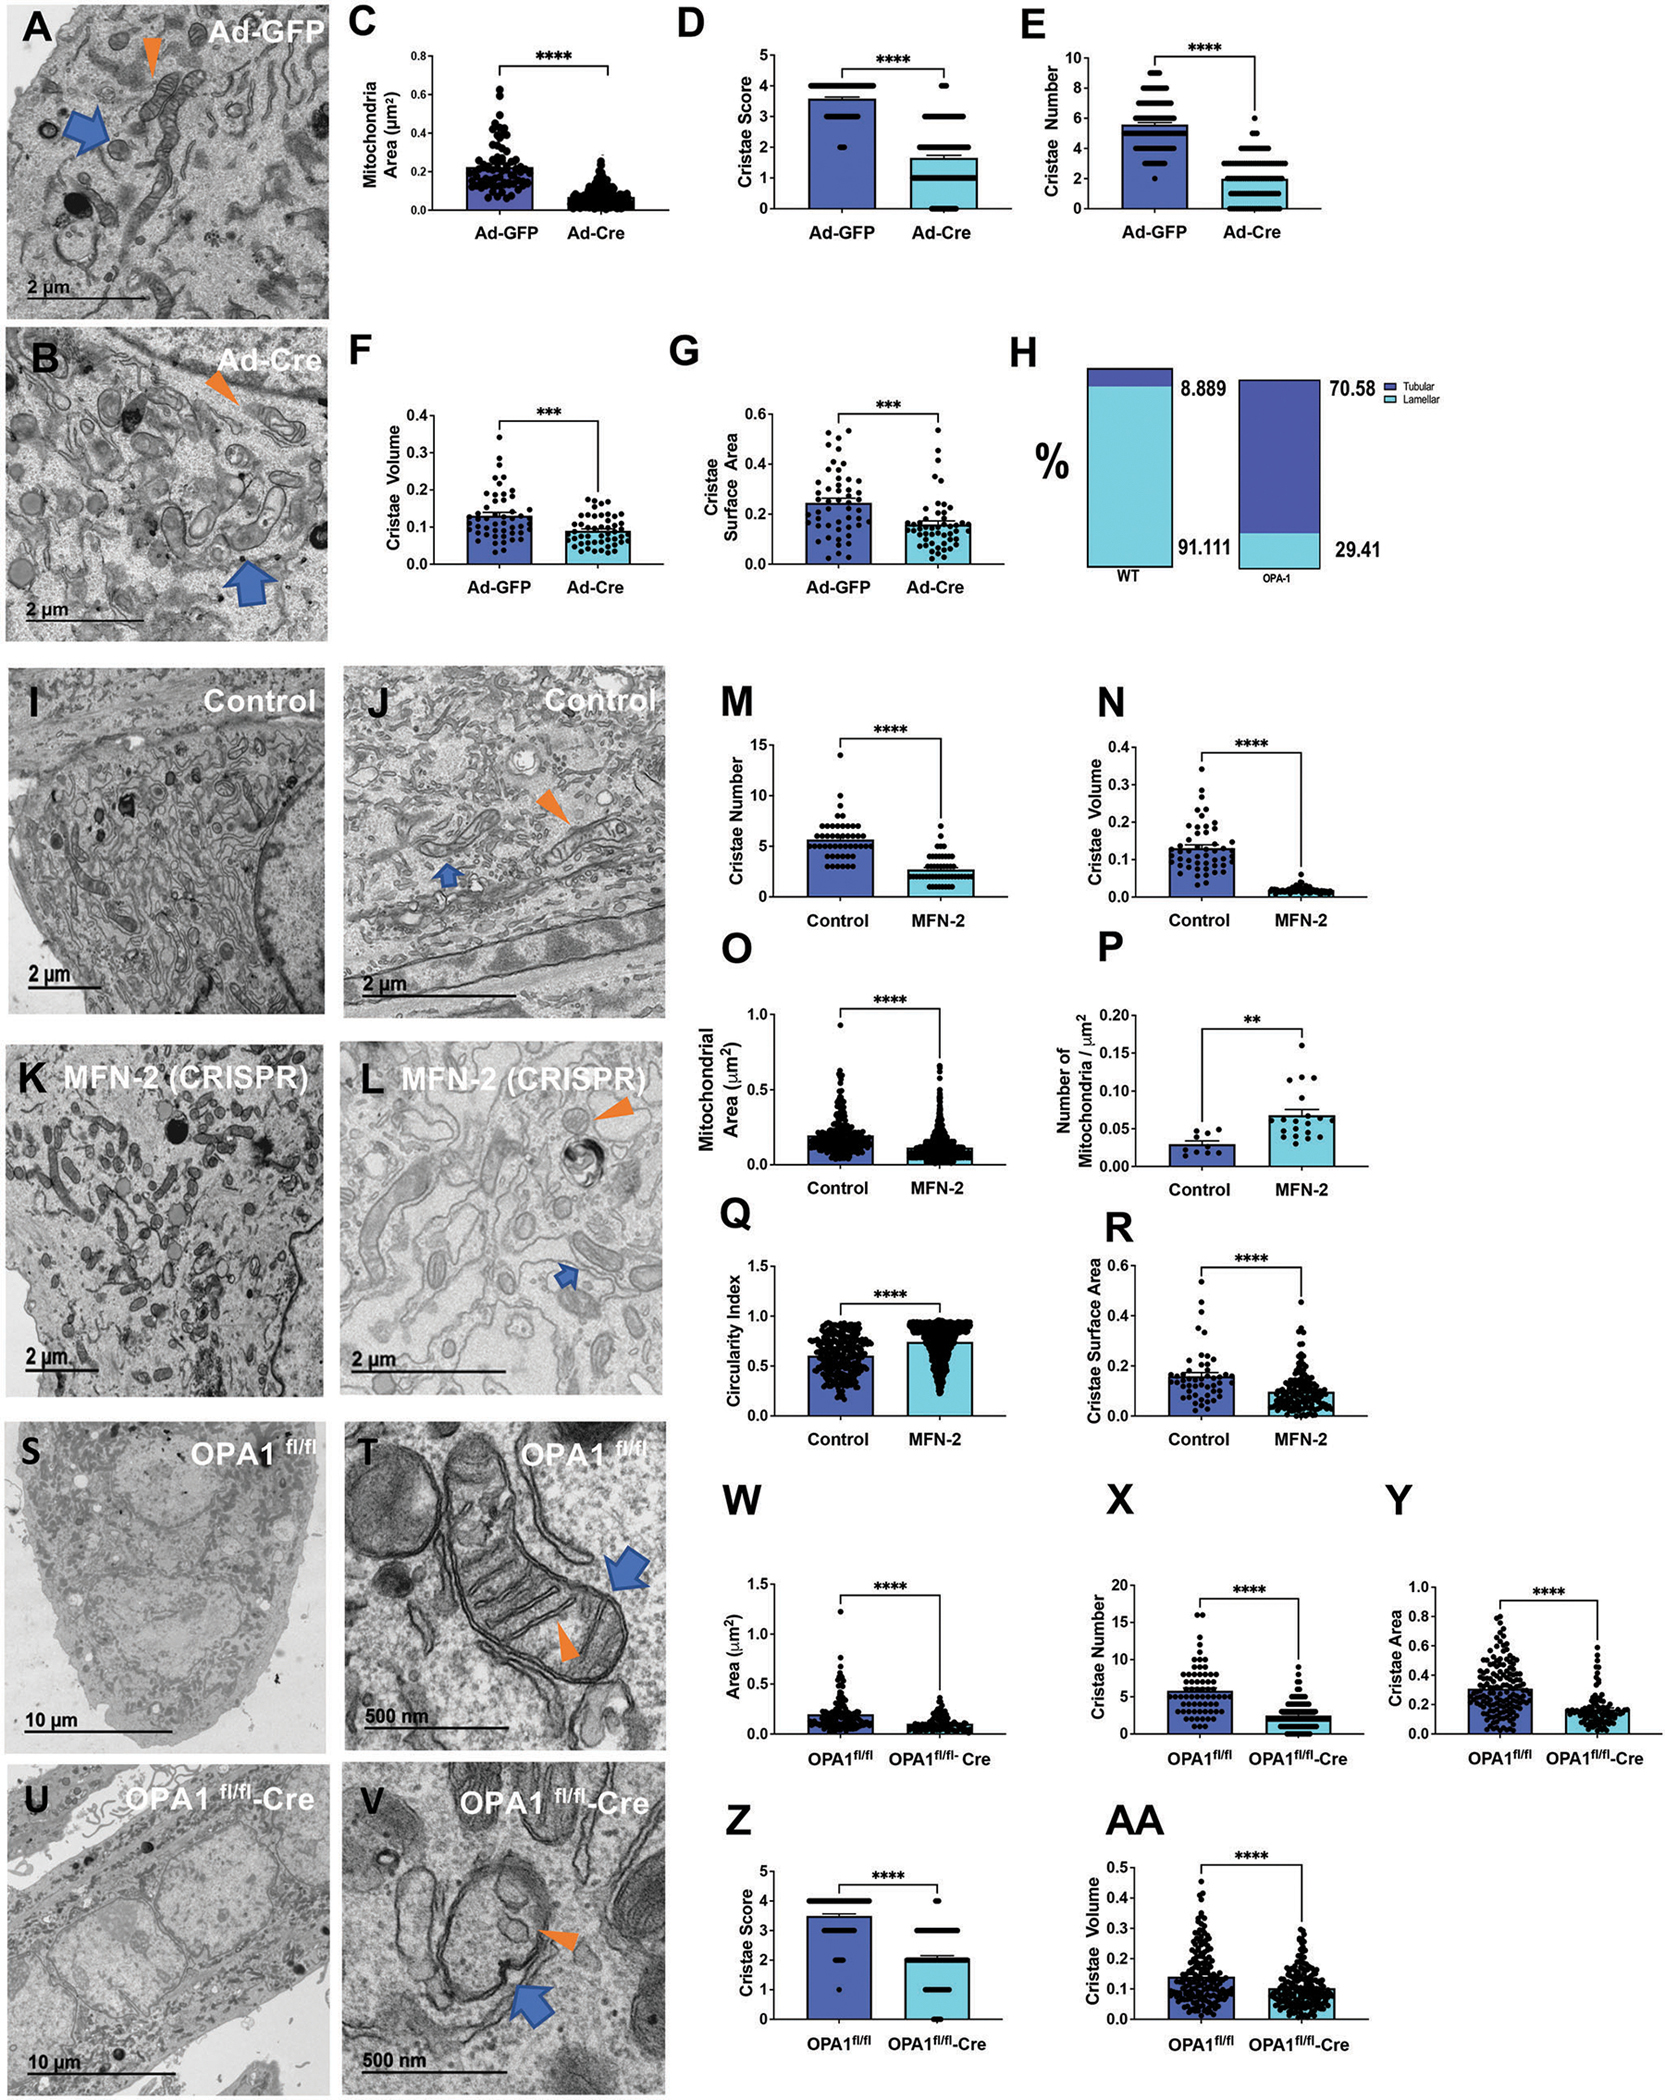
Figure 2.

Quantification of mitochondrial characteristics in Opa1-deficient murine skeletal muscle myoblasts and Mfn2-deficient or Opa1-deficient murine skeletal muscle myotubes. Ultrastructure of A) control and B) Opa1-deficient primary skeletal muscle myoblasts. Quantification of C) mitochondrial area, D) cristae score, E) cristae number, F) cristae volume, and G) cristae surface area in control and Opa1-deficient primary skeletal muscle myoblasts. H) Percentage of tubular and lamellar cristae in control and Opa1-deficient primary skeletal muscle myoblasts. Ultrastructure of I,J) control and K,L) Mfn2-deficient primary skeletal muscle myotubes. Quantification of M) cristae number, N) cristae volume, O) mitochondrial area, P) number of mitochondria per μm2, Q) circularity index, and R) cristae surface area in control and Mfn2-deficient skeletal muscle myotubes. Ultrastructure of S,T) control and U,V) Opa1-deficient primary skeletal muscle myotubes. W) Quantification of area, X) cristae number, Y) cristae area, Z) cristae score, and AA) cristae volume in control and Opa1-deficient skeletal muscle myotubes. Scale bars: A,B,I–L) 2 μm; S,U) 10 μm; T,V) 500 nm. Recombinant eGFP adenovirus (Ad-GFP) serves as a control while adenovirus-cre represents the experimental knockout. Opa1fl/fl represents a control while Opa1fl/fl-cre represents floxed deletion of Opa1. Blue arrows indicate mitochondria; orange arrows indicate cristae. Significance was determined using Welch’s t-test. **p < 0.01, ***p < 0.001, ****p < 0.0001.
