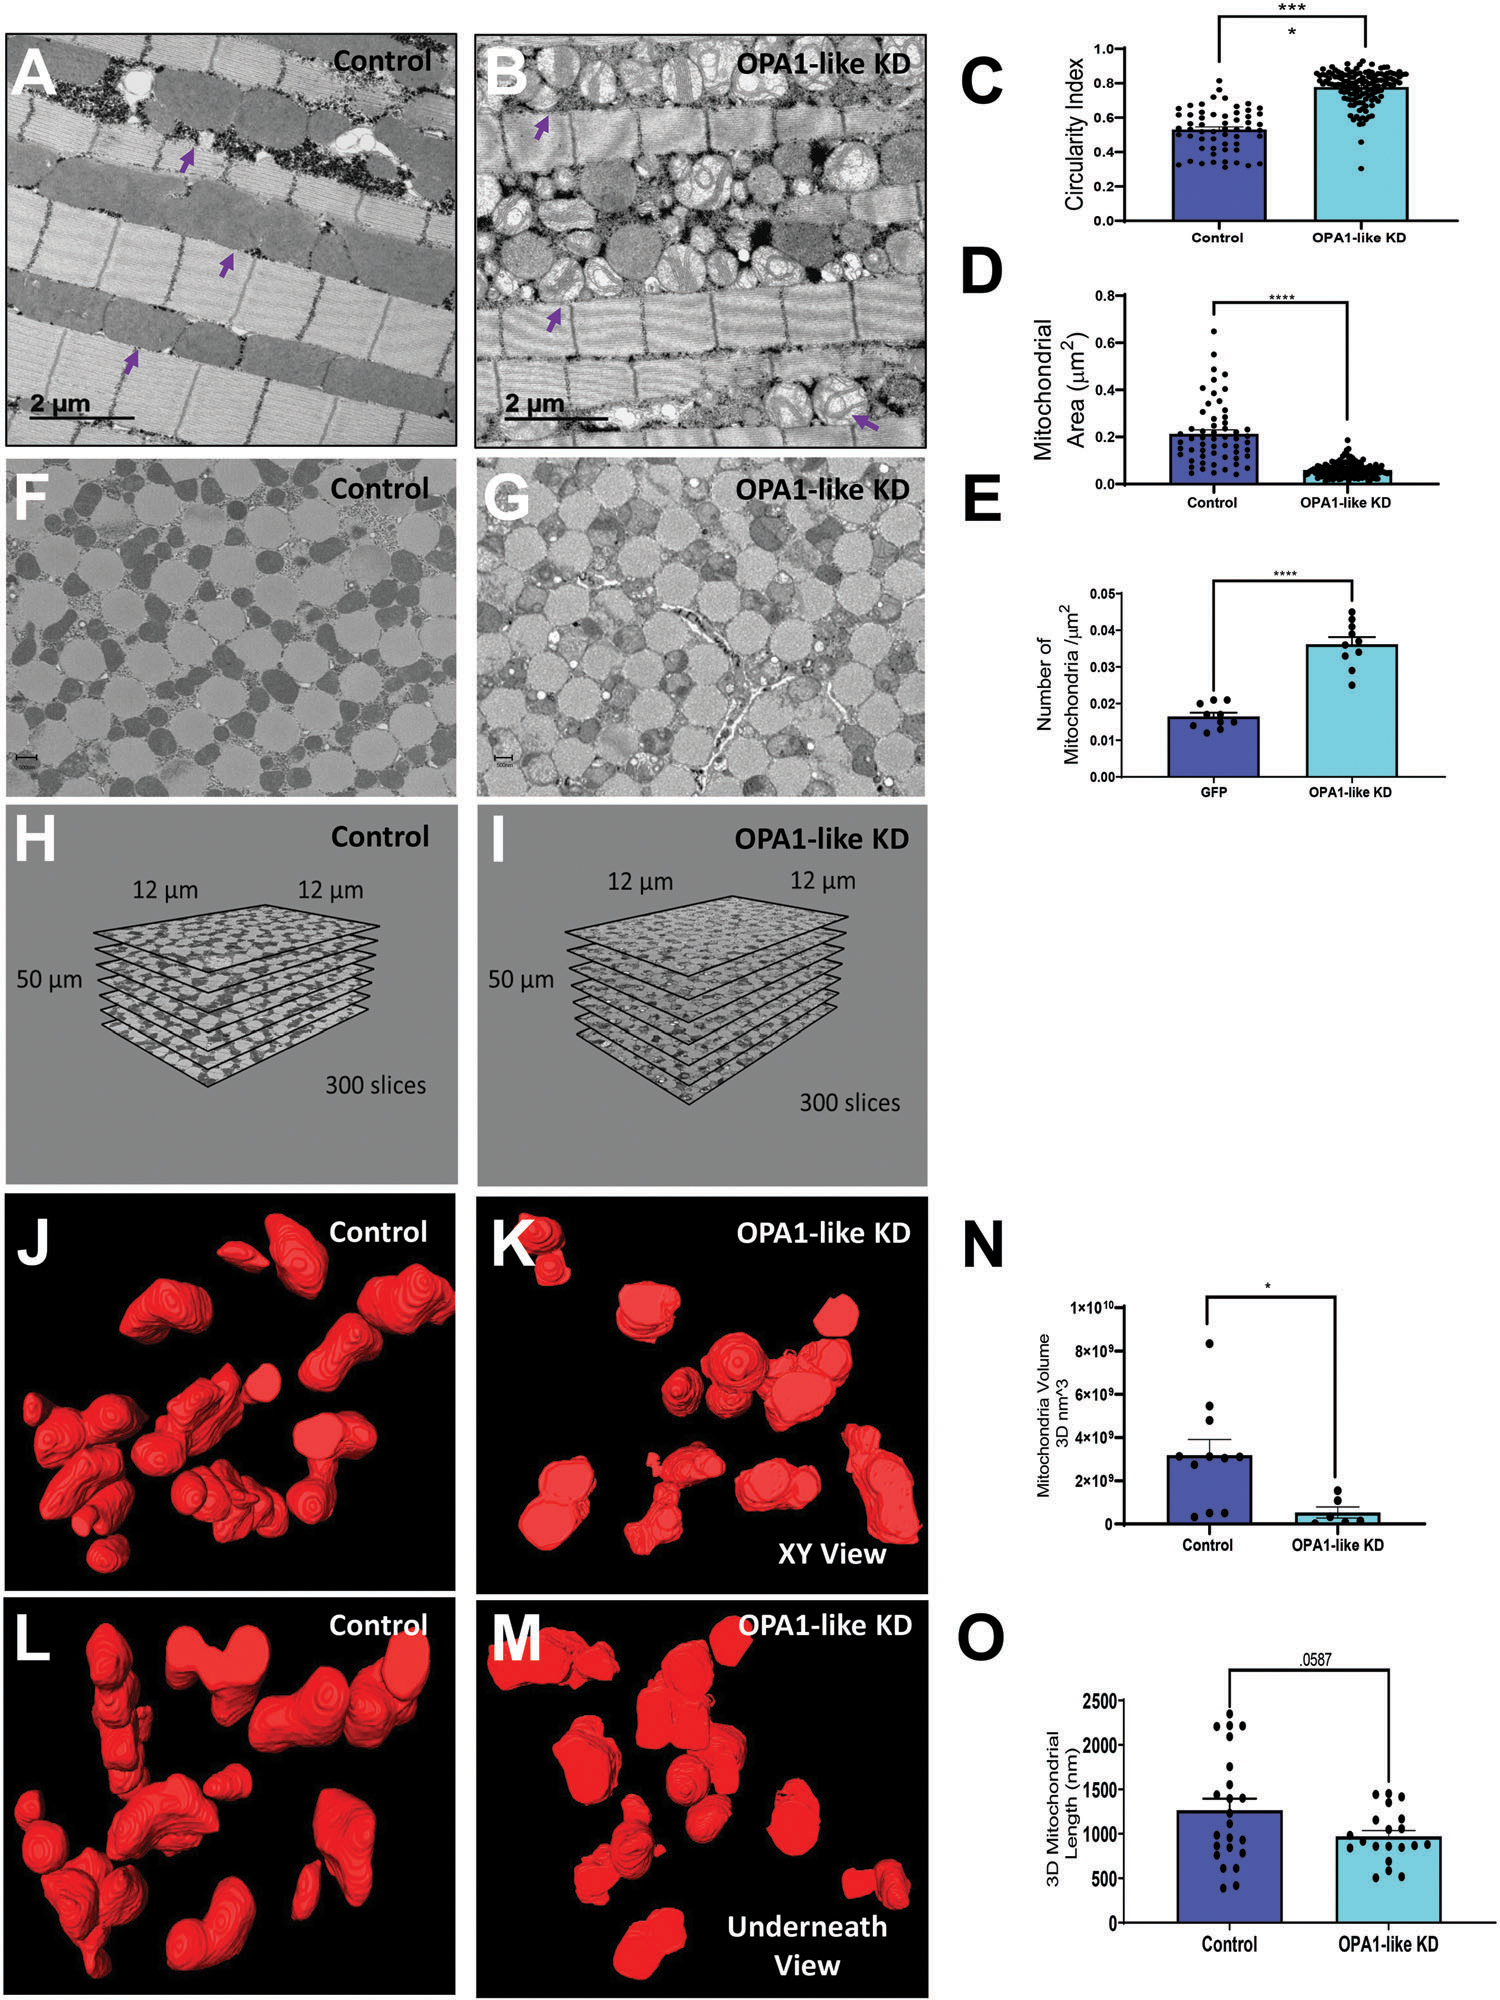
Figure 7.

3D EM reconstruction of Drosophila indirect flight muscle. A,B) TEM Micrograph of from mitoGFP control (A) and Opa1-like KD (B) Drosophila flight muscles. Purple arrows identify representative mitochondria. Quantification of C) circularity index, D) mitochondrial area, and E) mitochondrial number in control and Opa1-like-KD Drosophila flight muscles. Serial block face-scanning EM micrograph of flight muscle mitochondrial morphology from F) control and G) Opa1-like KD Drosophila flight muscles. Z-stack generated using SBF-SEM from H) control and I) Opa1-like KD Drosophila muscles used for 3D reconstructions. XY 3D reconstruction view of indirect flight muscle mitochondrial morphology from J) control and K) Opa1-like KD Drosophila using SBF-SEM. Underneath 3D reconstruction view of skeletal muscle mitochondrial morphology from L) control and M) Opa1-like KD Drosophila using SBF-SEM. Quantification of N) mitochondrial volume and O) mitochondrial length generated using 3D EM reconstruction and SBF-SEM in Opa1-like KD Drosophila flight muscle compared to control. Significance was determined using a Mann–Whitney test. *p < 0.05, **p < 0.01, ***p < 0.001, ****p < 0.0001.
