Figure 5.

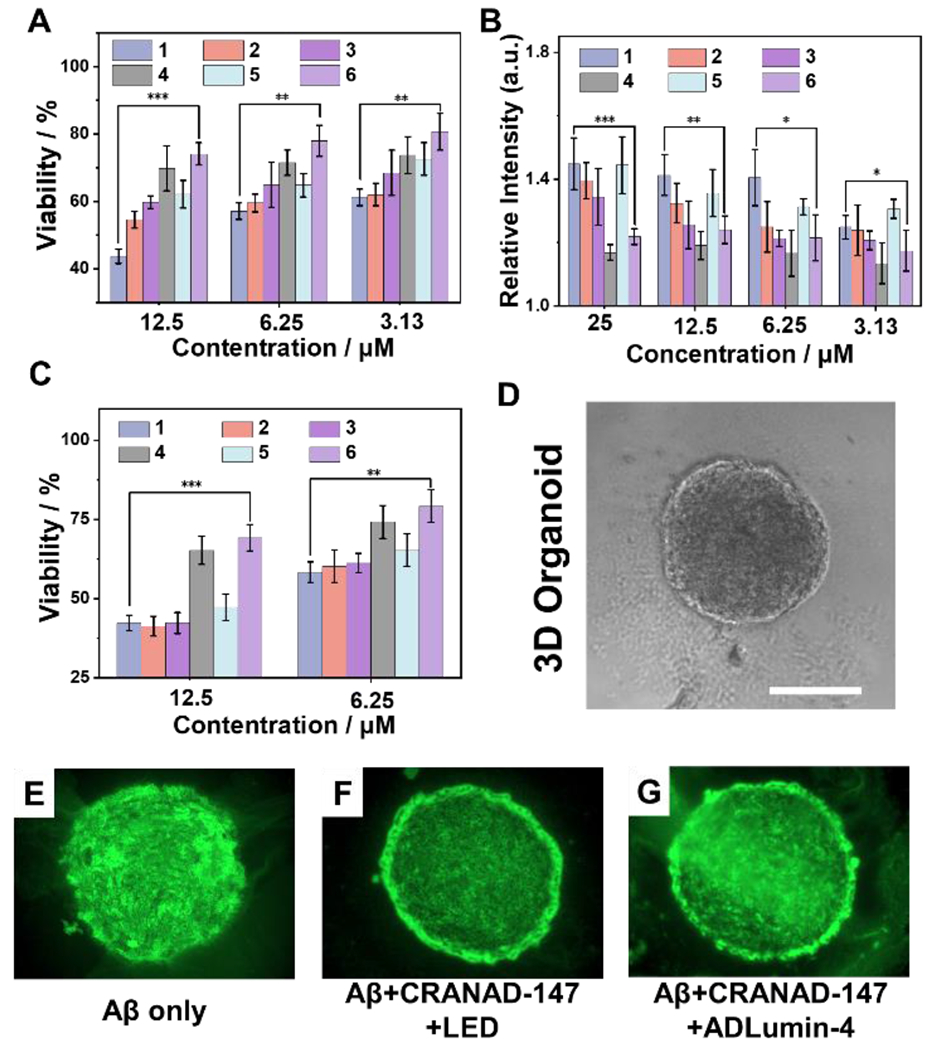
Cell viability studies with different treatments. A) Cell viability assays by ATP kit of SH-SY5Y cells with different Aβs. B) Aβ neurotoxicity reported via adenylate kinase assays with SH-SY5Y cells. C) Cell viability assessment with ATP method for 3D organoids from iPS cell cultures. Group 1: Aβ only; group 2: Aβ + LED; group 3: Aβ + CRANAD-147; group 4: Aβ + CRANAD-147 + LED; group 5: Aβ + ADLumin-4; group 6: Aβ + CRANAD-147 + ADLumin-4. *** P < 0.001, ** P < 0.01, * P < 0.05. D-G) Representative images of 3D organoid slices visualized by ApopTag(®) for apoptosis induced by Aβs. Scale bar: 500 μm.
