
Figure 5: Cell mixing experiments reveal robust heterophilic adhesion complexes between marginal microvilli.
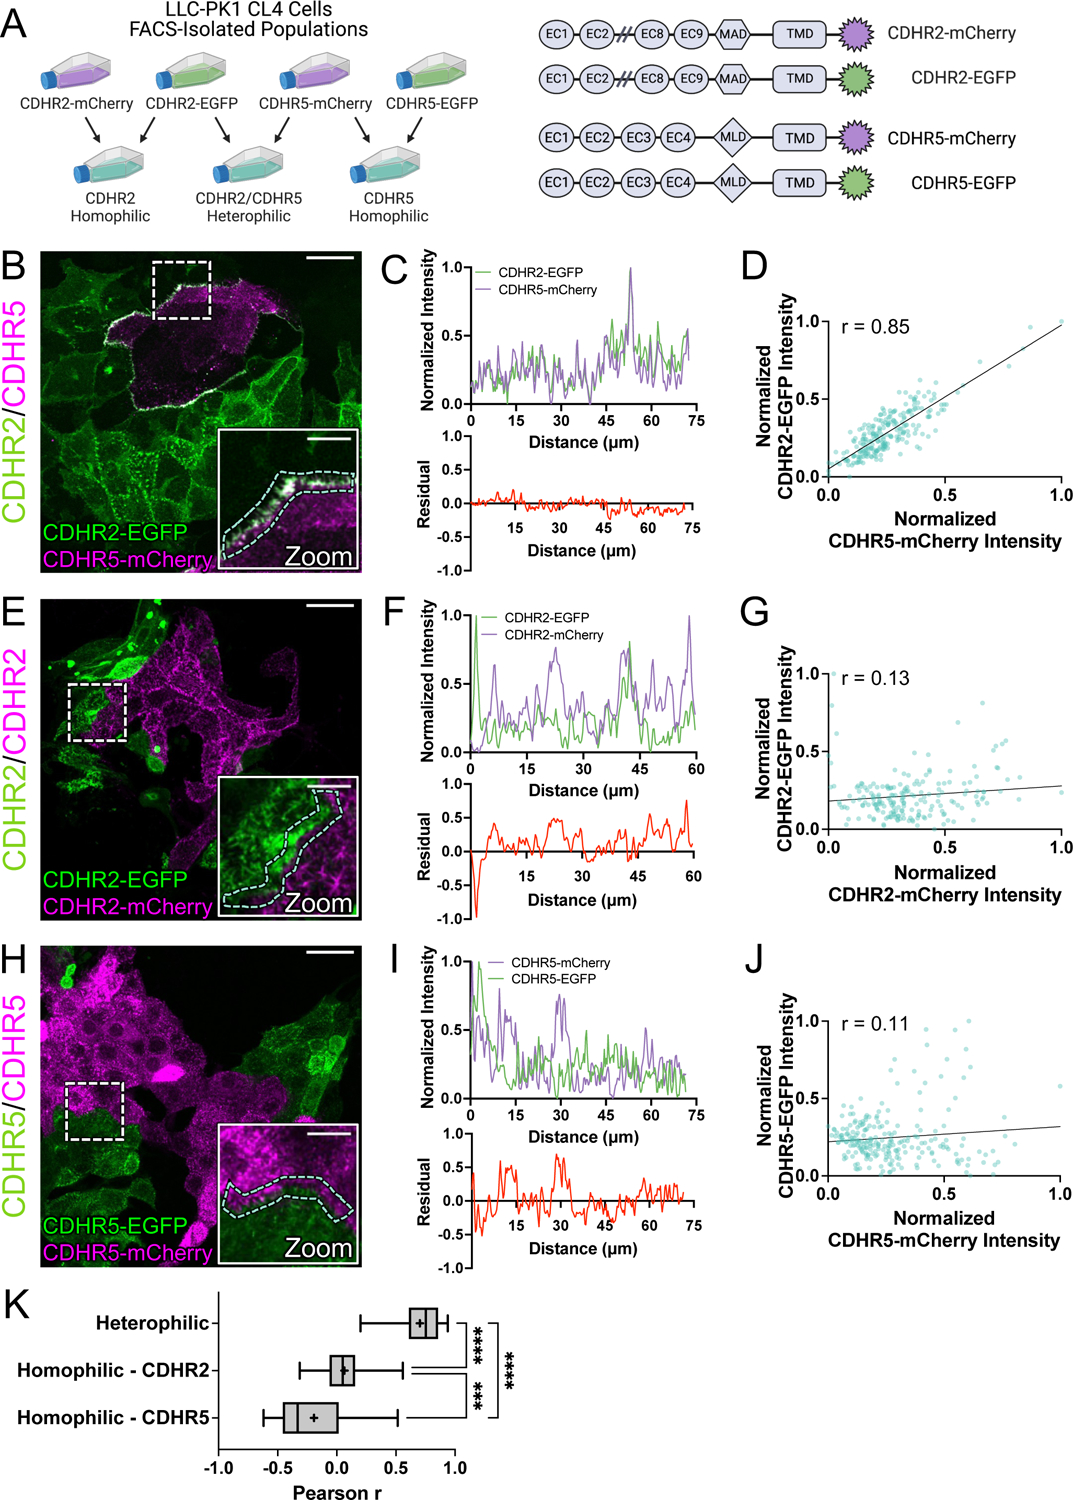
(A, left) Schematic depicting cell mixing method for the C-terminally tagged cadherin overexpression constructs (A, right). (B) MaxIP laser scanning confocal image of mixed heterophilic CDHR2-EGFP and CDHR5-mCherry CL4 cell populations. Dashed box represents zoom area and cyan dashed outline represents sample linescan. (C, top) Normalized fluorescence intensity plot taken from a representative linescan along the mixed cell interface. (C, bottom) Plotted difference (residual) of mCherry signal from EGFP signal from the top linescan plot. (D) Pearson’s r correlation plot from the linescan in (C); r = 0.85. (E) MaxIP of mixed homophilic CDHR2-EGFP and CDHR2-mCherry CL4 cells. (F-G) Representative linescan and respective Pearson’s r correlation; r = 0.13. (H) MaxIP of mixed homophilic CDHR5-EGFP and CDHR5-mCherry CL4 cells. (I-J) Representative linescan and respective Pearson’s r correlation; r = 0.11. (K) Combined Pearson’s r values from n = 30 individual linescans of each cell mixing scenario from 3 independent fixation and staining experiments (10 linescans per experiment). Mean Pearson’s r values are denoted by a “+” for each scenario where heterophilic r = 0.70, homophilic CDHR2 r = 0.07, and homophilic CDHR5 r = −0.19. Ordinary one-way ANOVA with multiple comparisons; **** p ≤ 0.0001 and *** p ≤ 0.001. Scale bars: 30 μm (B, E, H), 10 μm (zoom insets).