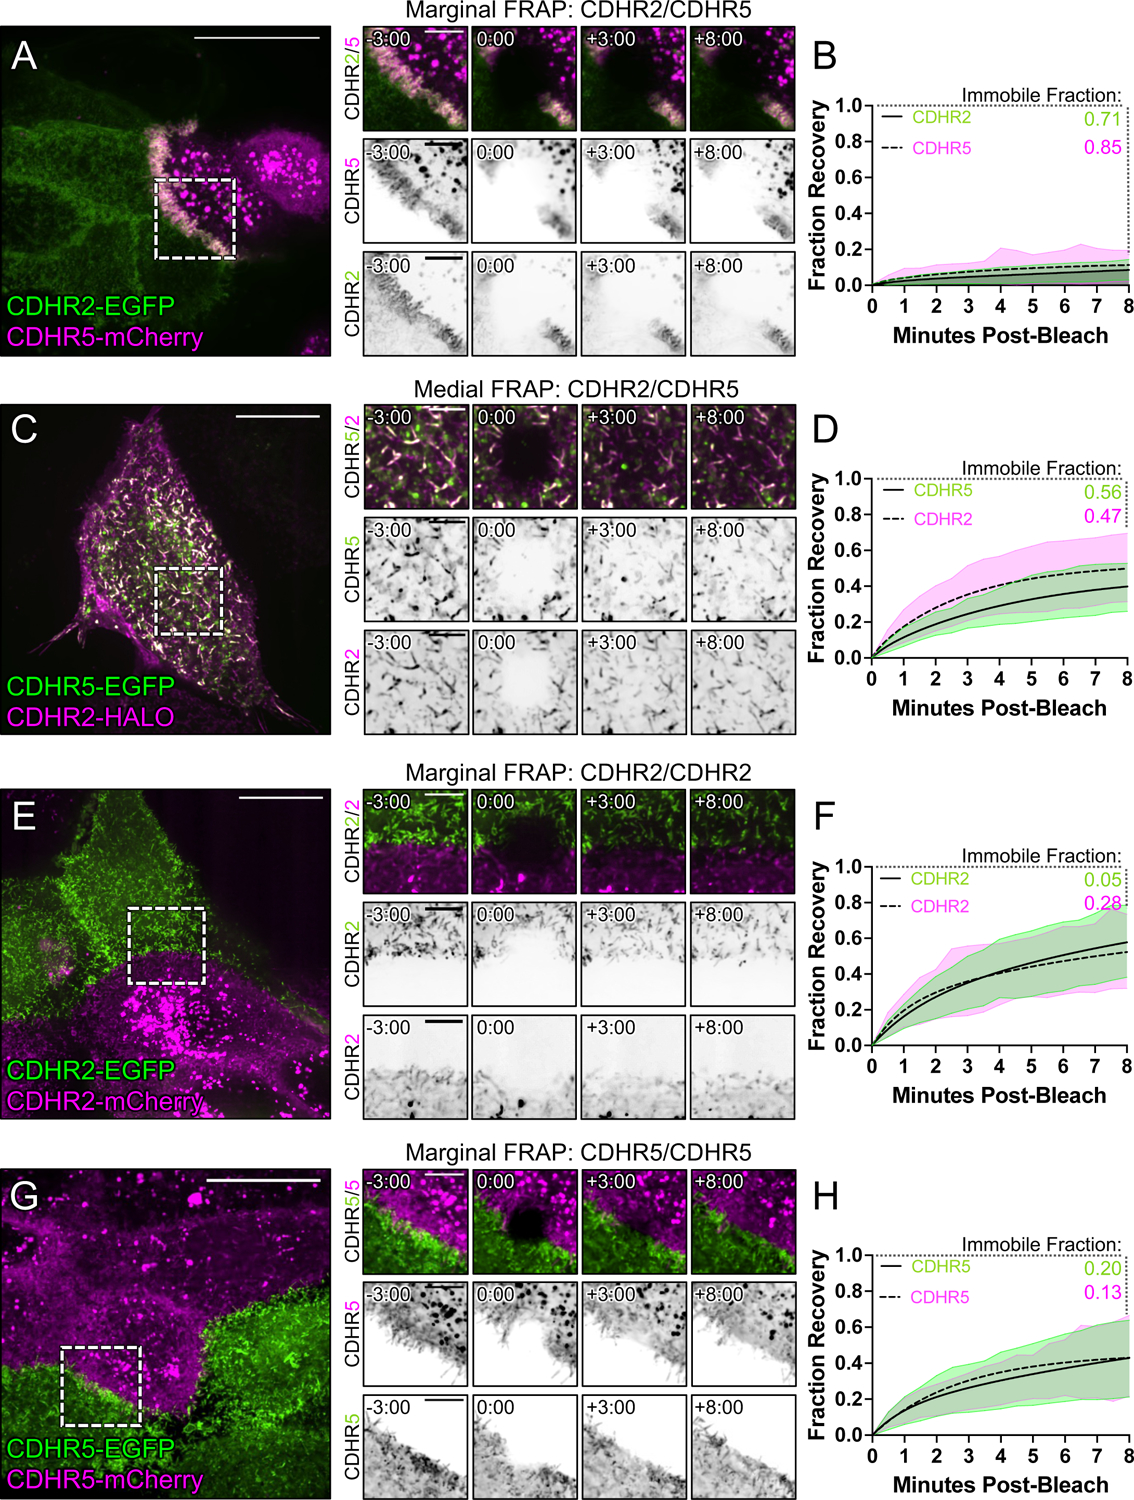
Figure 6: FRAP analysis suggests that heterophilic, transjunctional adhesion complexes are stable.

Mixed CL4 cells forming (A) marginal heterophilic, (C) medial heterophilic, (E) marginal homophilic CDHR2, and (G) marginal homophilic CDHR5 adhesion complex interfaces. Dashed boxes outline the photobleached ROI shown in the recovery montages on right. (B, D, F, H) Fluorescence recovery is plotted over the course of 8 minutes with the immobile fractions as written for each protein channel. Immobile fractions were calculated from a two-phase association curve by subtracting the predicted plateau from 1 (100% fluorescence recovery). All plots represent 3 independent FRAP experiments of n ≥ 20 ROIs from multiple cells. Scale bars: 20 μm (A, C, E, G), 5 μm (montages).
