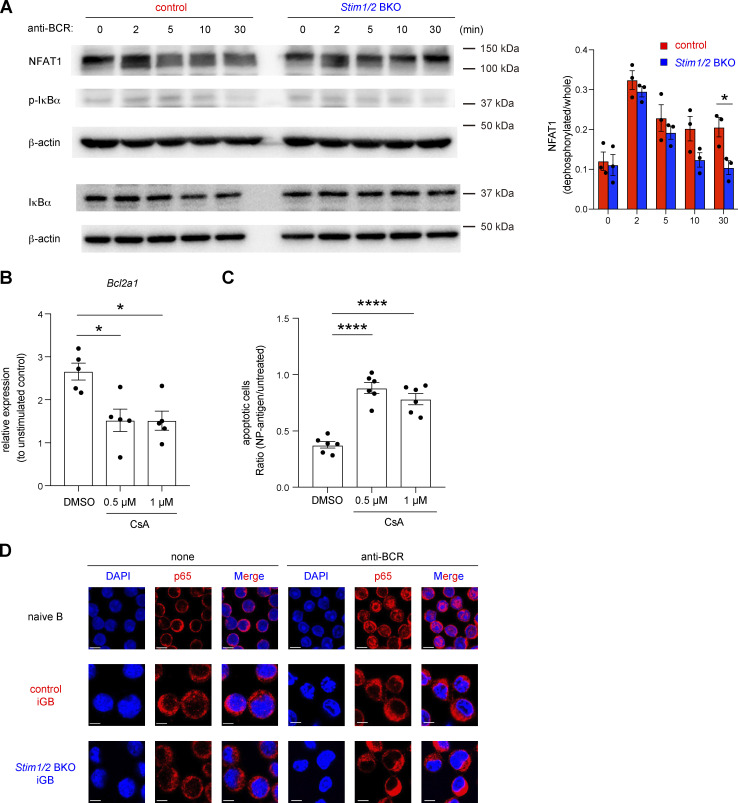
Figure 6.
Bcl2a1 expression is regulated by NFAT1. (A) Naive B cells from control and Stim1/2 BKO mice were cultured with 1 ng/ml IL-4 on 40LB feeder cells for 6 days before stimulation with 10 µg/ml anti-IgM and anti-IgG. Western blot analysis of NFAT1, phosphorylated IκBα (p-IκBα) and total IκBα were performed at the indicated time points. β-actin was used as a loading control. Representative data from three independent experiments are shown on the left. Densitometric analysis of NFAT1 pooled from three independent experiments is shown on the right. *, P < 0.05 (two-way ANOVA). (B) qRT-PCR of mRNA encoding Bcl2a1 in iGB cells after stimulation with anti-IgG in the presence or absence of CsA, normalized to the expression of β-actin. Data are shown as relative expressions to unstimulated control. Data are presented as mean ± SEM of five measurements. Data are pooled from two independent experiments. *, P < 0.05 (ordinary one-way ANOVA). (C) Obtained Igκ-negative iGB cells from B1-8high B cells were stimulated with or without 4 µg/ml NP-Ficoll under the indicated concentration of CsA for 16 h. The ratio of apoptotic cells upon NP-Ficoll stimulation to untreated samples are shown. Data are presented as mean ± SEM of six measurements from two independent experiments. Each experiment was performed with pooled B cells from three mice. ****, P < 0.0001 (ordinary one-way ANOVA). (D) Naive B cells and obtained iGB cells from control and Stim1/2 BKO mice were stimulated with or without 10 µg/ml anti-IgM and anti-IgG for 3 h. The nuclear localization of NF-κB was assessed by confocal microscopy. Scale bar shows 5 μm. Representative data are shown from two independent experiments. Source data are available for this figure: SourceData F6.

