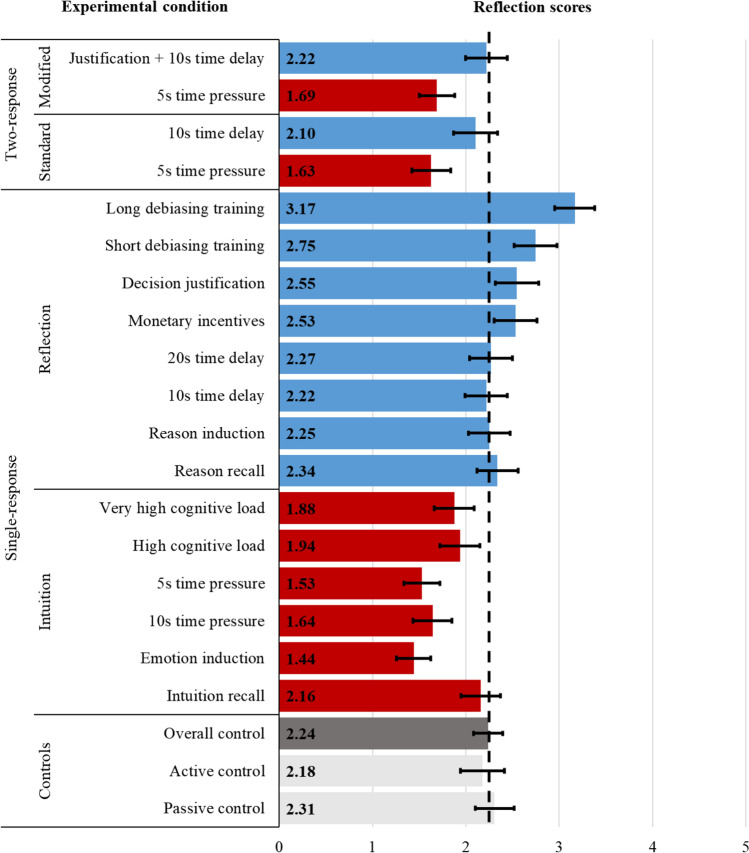
Fig. 1.
Reflection scores. The bars indicate the average reflection score (i.e., number of correct answers out of the five questions on the Cognitive Performance Test) in the control conditions (gray bars), intuition manipulations (red bars), and the reflection manipulations (blue bars) across the single-response and the two-response conditions. The dashed vertical black line indicates the average reflection score in the overall control (i.e., the pool of passive and active control conditions; M = 2.24, 95% CI [2.08, 2.40]). Error bars show 95% confidence intervals

