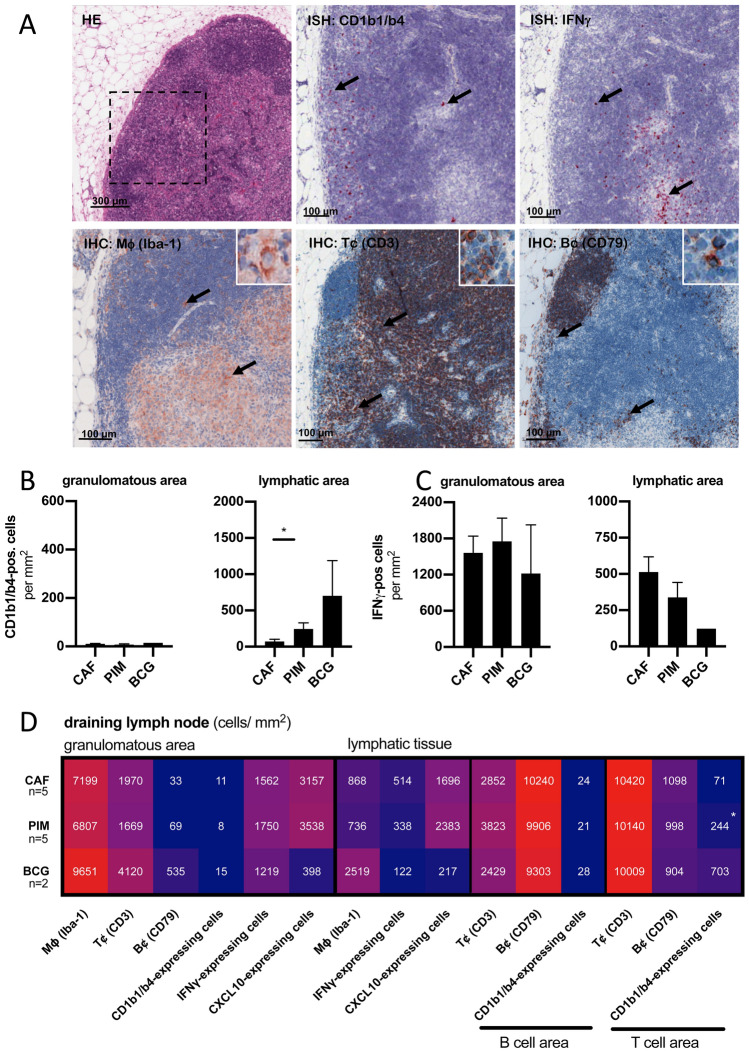
Figure 5.
Four weeks after Mtb-challenge CD1b1/b4-expressing cells localize in the T cell-rich subcapsular areas of draining lymph nodes. Sections of the same draining lymph nodes as shown before were investigated by ISH and IHC. (A) An HE-stained section of the right axillary lymph node from a PIM6-vaccinated animal is shown in low magnification. The rectangle is shown in higher magnification for consecutive sections stained by IHC for Iba-1 positive macrophages, CD3-expressing T cells and CD79-expressing B cells (inserts show single positive cells) and by ISH for the expression of CD1b1/b4 and IFNγ. Black arrows indicate single positive cells. The number of CD1b1/b4- (B) or IFNγ-expressing (C) cells per mm2 within lymph node granulomas or the surrounding lymphatic area was quantified. Black bars represent the group mean, error bars the standard error of the mean. (D) Consecutive sections of the same samples were additionally stained for macrophage marker Iba-1, B cell-marker CD79 or were subjected to ISH using a CXCL10-specific probe. The heatmap shows a comprehensive overview of the numbers of positive cells per mm2 within the granulomatous or the surrounding lymphatic areas. Rows correspond to the three vaccination groups, columns to the tested surface marker or transcript. Numbers represent group means for five CAF01- or PIM6-vaccinated and two BCG-vaccinated animals. Asterisks indicate the level of significance as calculated by Mann–Whitney-test in comparison to the CAF01-vaccinated group.

