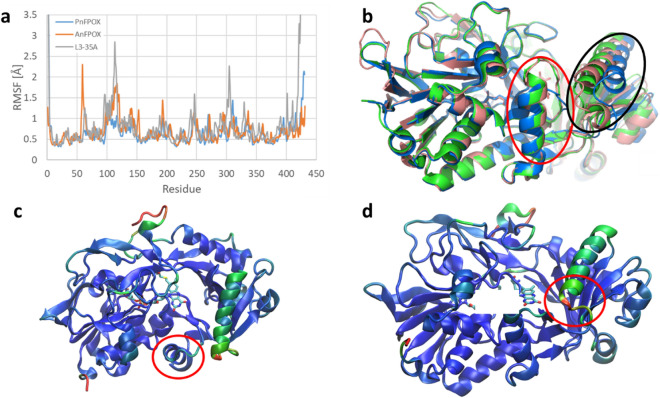
Figure 1.
Stability analysis from MD simulations. The RMSF profile (a) shows that in the L3-35A, the helix 96–111 and the surrounding structures present a high degree of instability compared to the other enzymes. In the structural comparison (b, PnFPOX:green, AnFPOX:pink and L3-35A:blue), this helix (circled black) shows also a different fold compared to the other two enzymes. The instability and different structural arrangement could be due to design operated on L3-35A, which removed part of the helix blocking the tunnel (c, circled red). These removed residues were facing the helix 96–111 in the parental enzymes and were making stabilizing interactions, which could explain why helix 96–111 is unstable in L3-35A, possibly leading to its lower activity (d, color coded by RMSF, where blue represents lower RMSF and green–red the regions with higher RMSF). Comparison of RMSF and structure of PnFPOX (green), AnFPOX (pink) and L3-35A (blue).

