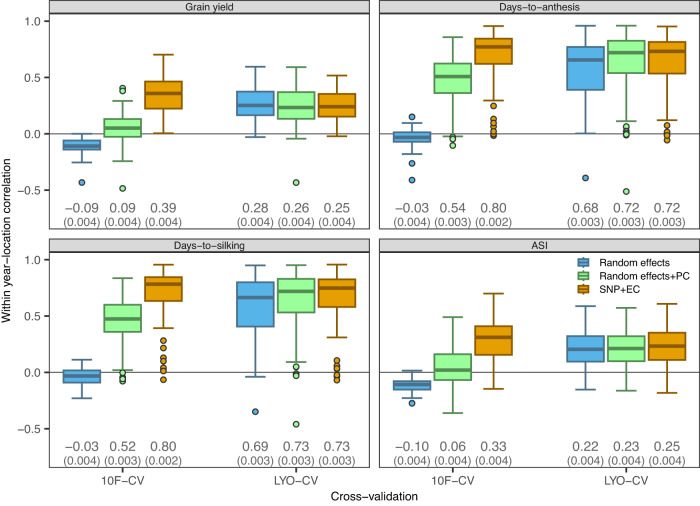
Fig. 7. Within year-location correlation between predicted and observed phenotypes for each model and cross-validation (CV) scheme in northern locations.
year-locations. The SNP + EC model includes SNPs and environmental covariates (EC). The random effects+PC model includes the top 10 SNPs-derived principal components (PC) plus the top 5 ECs-derived PCs. Models were fitted using 10F-CV (hybrids assigned to one of 10 folds) and LYO-CV (leave-one-year-out). The boxes represent the inter-quartile range (IQR) bounded by the 25th and the 75th percentiles. Line at the center of each box is the median. The whiskers extend from the IQR bounds to times the IQR. Points represent correlations lying outside the whiskers ends. Numbers at the bottom are the weighted average correlation and standard error (SE, in parenthesis). Source data are provided as a Source Data file.

