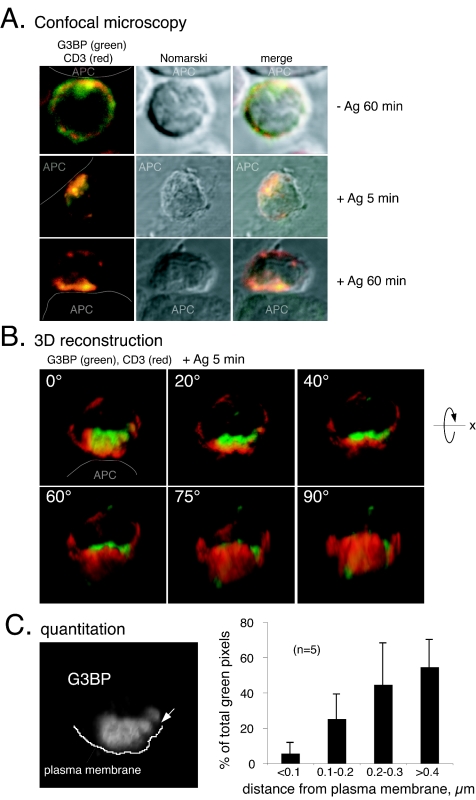
FIG. 4.
Parasynaptic localization of G3BP during antigen recognition. (A) Location of G3BP (green) and CD3 (red) in CD8+ OT-I T cells overlaid on control BOK cells (−Ag) or OVA-presenting SAMBOK APC (+Ag) and viewed under the confocal microscope as described in Materials and Methods. The second panel in each row is a Nomarski differential phase-contrast image of the same T-cell, and the last panel is an overlay of the two first panels. (B) Quantitation of G3BP location in relation to the plasma membrane in immune synapses. The data are given as a percentage of the total G3BP pixels within 100-nm-wide zones from the plasma membrane and represent the average ± the standard deviations from five different images, including the two three-dimensional reconstructions shown in panel B and in Fig. 5. (C) Three-dimensional reconstruction of a representative OT-I T-cell stained for G3BP (green) and CD3 (red) in contact with a SAMBOK cell (white arrow at the contact site). The reconstructed cell is gradually rotated counterclockwise around the x axis from panel to panel, so that the bottom right hand panel represents the direction from which the APC would see the T cell. Note that G3BP accumulates at the T-cell-APC contact site but remains ∼0.5 μm from the cell surface.

