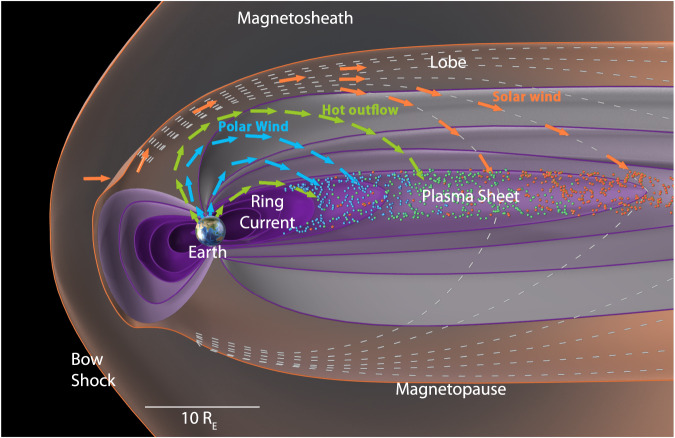
Fig. 1. Solar wind and ionospheric sources of the plasma sheet.
The pathways of the main sources of plasma to the plasma sheet during southward IMF are illustrated in a schematic of Earth’s magnetosphere (based on Fig. 1 of ref. 1). The arrows represent the approximate paths of the different sources. Orange indicates the solar wind, coming in through the dayside magnetopause due to reconnection, and flowing along lobe field lines that convect to the plasma sheet. Green represents the hot outflow from the dayside (cusp) and nightside auroral regions. Blue represents the polar wind, outflowing from the polar cap. These sources mix in the plasma sheet with the contribution of the different sources changing with time.

