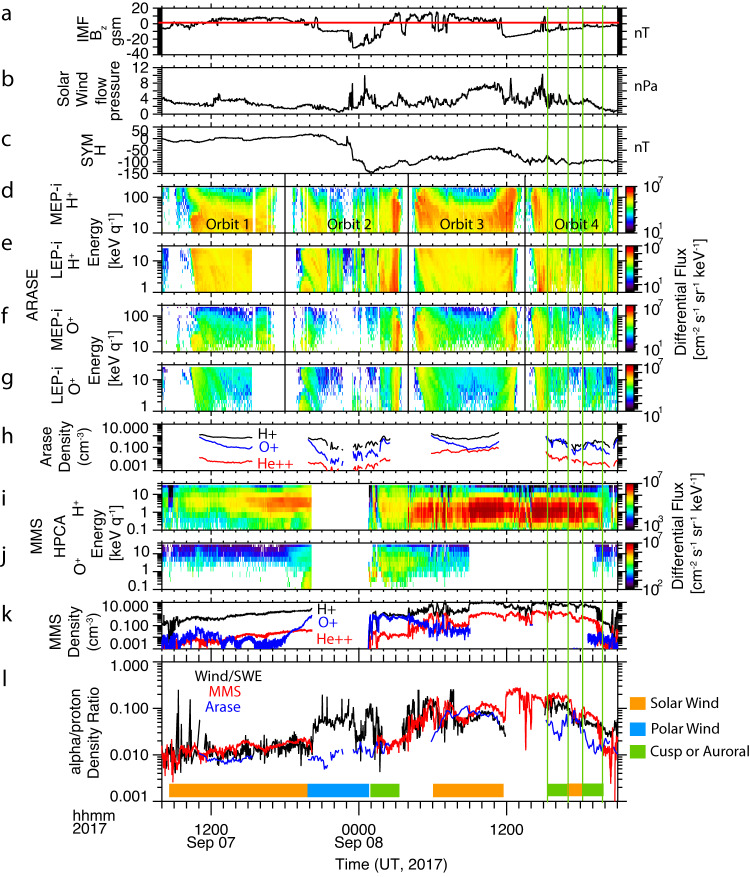
Fig. 4. Comparison of Arase and MMS measurements with solar wind composition.
a, b Total and Bz component of the interplanetary magnetic field (IMF) from the OMNI dataset, propagated to the location of the Earth Bow Shock. c SYM-H index, d–g Arase H+ and O+ Differential Flux, covering the range from 1–180 keV per q. h H+, O+, and He++ density at Arase integrated over the energy range 1–180 keV per q. i, j H+ and O+ differential flux at MMS. k H+, O+ and He++ Density at MMS. l He++/H+ density ratio, from Wind/SWE (black), MMS (red), and Arase (blue). The color bar at the bottom identifies the dominant source of the plasma in each location: solar wind (orange), polar wind (blue), and cusp or nightside auroral (green). The two cusp or auroral source time periods in orbit 4 are also indicated with green vertical lines.

