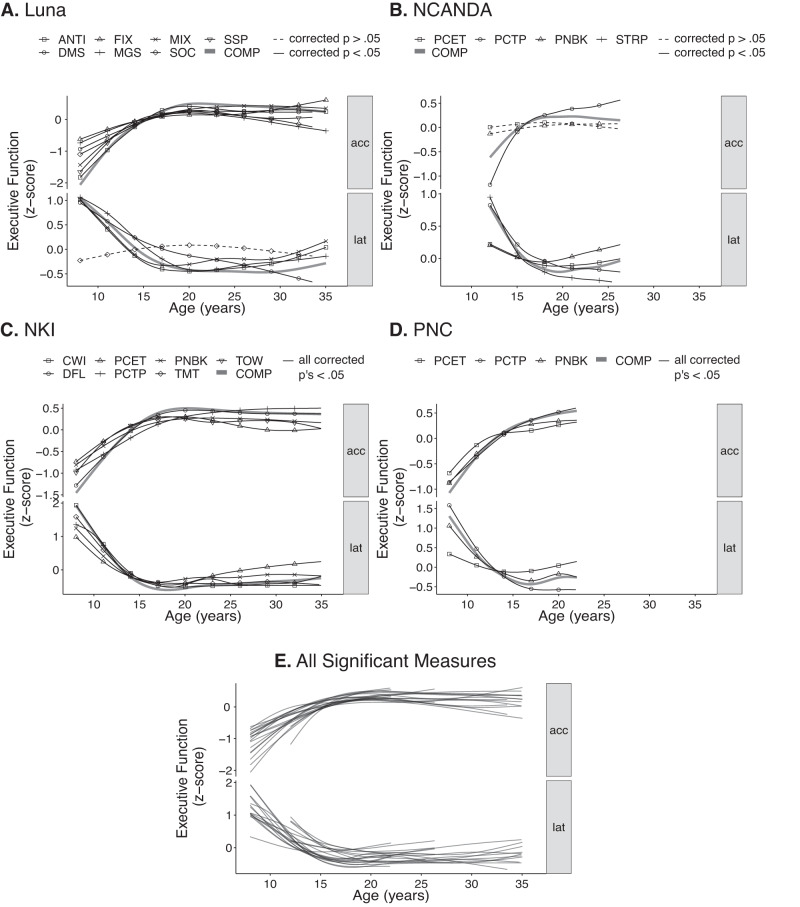
Fig. 1. Age trajectories of executive function measures.
All measures scaled to per-dataset standard deviation (z) units. A Non-linear fits from the Luna dataset (N = 196; 666 total visits) of general additive mixed model (GAMM; multilevel penalized spline regression) for Antisaccade (ANTI), Fixation Breaks (FIX), Mixed Antisaccade/Visually Guided Saccade (MIX), Spatial Span (SSP), Delayed Matching to Sample (DMS), Memory Guided Saccade (MGS), Stockings of Cambridge (SOC), and equally weighted composite metrics (z score sum of all accuracy, latency measures; COMP) as a function of age for accuracy measures (acc; top) and latency (lat; bottom). All models covaried for a smoothed effect of visit number. Solid line indicates models with Bonferroni corrected significance (corrected p < 0.05 [two-tailed], unadjusted p < 0.003 [two-tailed]). Dashed indicates models that do not surpass this threshold. B Non-linear, GAMM fits from NCANDA dataset (N = 831; 3412 total visits) for Penn Conditional Exclusion (PCET), Penn Continuous Performance (PCTP), Penn N Back (PNBK), and Stroop (STRP) tests and equally weighted accuracy, latency composite metrics (COMP) as a function of age. All models covaried for a smoothed effect of visit number. Solid line indicates models with Bonferroni corrected significance (corrected p < 0.05 [two-tailed], unadjusted p < 0.006 [two-tailed]). Dashed indicates models that do not surpass this threshold. C Non-linear fits from NKI dataset (N = 588) of general additive models (GAM; penalized spline regression) for D-KEFS Color-Word Interference (CWI), Penn Conditional Exclusion (PCET), Penn N Back (PNBK), D-KEFS Tower (TOW), D-KEFS Design Fluency (DFL), DKEF Penn Continuous Performance (PCTP), and D-KEFS Trails (TMT) tests and equally weighted accuracy and latency composite metrics (COMP) as a function of age. All models were corrected, significant (corrected p’s < 0.001 [two-tailed]). D Non-linear, GAM fits from PNC dataset (9151) for Penn Conditional Exclusion (PCET), Penn Continuous Performance (PCTP), and Penn N Back (PNBK) and equally weighted accuracy and latency composite metrics (COMP) as a function of age. All models were corrected, significant (corrected p’s < 0.001 [two-tailed]). E Fits from all corrected significant models from A–D. See also Supplementary Table S3 for accompanying statistics.

