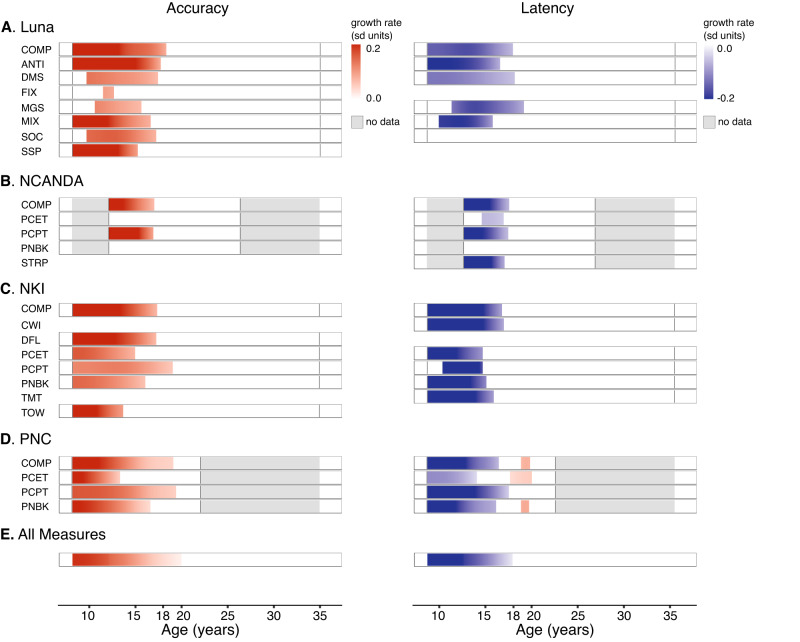
Fig. 2. Developmental periods with significant age-related change in executive function.
Age-ranges in which the simultaneous (to account for multiple testing) 95% confidence interval (generated via posterior simulation50 with 10,000 iterations) of the first derivative of the GAM/GAMM fits did not include zero (p < 0.05, two-sided) were classified as statistically significant. Using this method, raster plots display color (red: age-related increases; blue: age-related decreases) when the derivative is statistically significant (p < 0.05, two-sided) and white when the derivative is not statistically significant (p > 0.05, two-sided). Vertical black lines in each bar denote the minimum and maximum age of the included dataset. Gray bars indicate no data within the specified age range for that analysis dataset. Accuracy measures for all datasets are shown on the left and latency on the right. A Luna dataset (N = 196; 666 total visits) measures from equally weighted composite metrics (z score sum of all accuracy, latency measures; COMP), Antisaccade (ANTI), Delayed Matching to Sample (DMS), Fixation Breaks (FIX), Memory Guided Saccade (MGS), Mixed Antisaccade/Visually Guided Saccades (MIX), Stockings of Cambridge (SOC), and Spatial Span (SSP). B NCANDA dataset (N = 831; 3412 total visits) measures from equally weighted accuracy, latency composite metrics (COMP), Penn Conditional Exclusion (PCET), Penn Continuous Performance (PCTP), Penn N Back (PNBK), and Stroop (STRP). C NKI dataset (N = 588) measures from equally weighted accuracy and latency composite metrics (COMP), D-KEFS Color-Word Interference (CWI), D-KEFS Design Fluency (DFL), Penn Conditional Exclusion (PCET), Penn Continuous Performance (PCTP), Penn N Back (PNBK), D-KEFS Trails (TMT), and D-KEFS Tower (TOW). D PNC dataset (N = 9151) measures from equally weighted accuracy and latency composite metrics (COMP), Penn Conditional Exclusion (PCET), Penn Continuous Performance (PCTP), and Penn N Back (PNBK). E An aggregate analysis (pointwise three-level meta-analysis), incorporating all measures from all datasets was performed using the metafor package51 with effects nested in measure and study (see also Methods) and thresholded in the same manner as the other bars (red or blue denoting statistically significant [p < 0.05, two-sided; via simultaneous confidence intervals] age-related increases or decreases, respectively).

