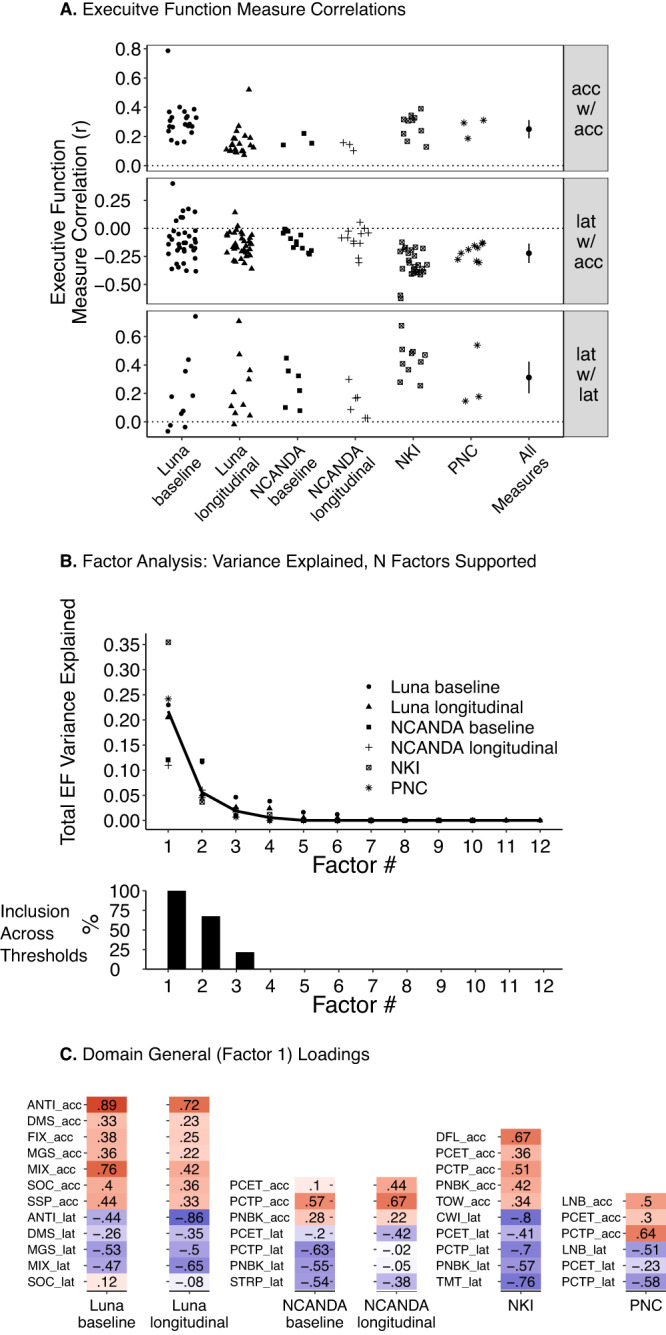
Fig. 3. Correlation and factor structure of executive function measures.

A Linear, bivariate correlation (r) for Luna (N = 196; 666 total visits), NCANDA (N = 831; 3412 total visits), NKI (N = 588), and PNC (N = 9151) datasets among accuracy measures (acc w/ acc), accuracy with latency measures (acc w/ latency), and among latency measures (lat w/ lat). For longitudinal datasets (Luna, NCANDA), baseline correlations were calculated from first visit, longitudinal correlations were calculated from disaggregation analysis (see Methods). “All measures” indicates estimate (black dot; measure of center) and 95% confidence interval (± 2 standard errors) from three-level meta-analysis (correlation pairs nested in task pairs and datasets). B Top panel displays total executive function (EF) variance explained as a function of extracted factor using a bifactor rotation for each dataset (maximum number of factors extracted per dataset based on total measures per dataset [Luna, 12 measures/factors, NCANDA 7 measures/factors, NKI 10 measures/factors, PNC 6 measures/factors]. Black line indicates mean across datasets. Bottom panel displays factor inclusion across thresholds (parallel analysis, optimal coordinate, acceleration factor, and a factor analytic Kaiser rule; see Methods) and datasets (e.g., 100% indicates factor included across all thresholds and datasets; see Supplementary Fig. S7 for individual datasets). C Loadings for domain general factor (factor 1 via bifactor rotation) for each dataset and by baseline and longitudinal (via disaggregation; see Methods) for Luna and NCANDA.
