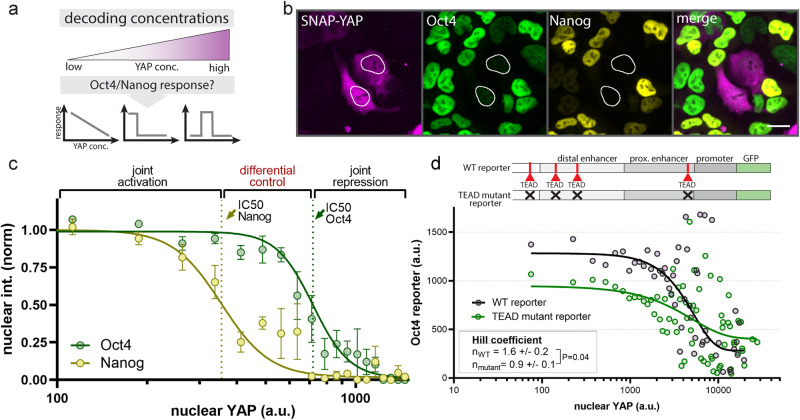
Fig. 2. Differential control of Oct4 and Nanog through steady-state YAP concentrations.
a Probing the dose response of Oct4 and Nanog accumulation as a function of steady-state YAP concentrations. b SNAP-tag and immunofluorescent staining for SNAP-YAP, Oct4 and Nanog at 48 h post undirected differentiation start shows that YAP is a repressor of Oct4 and Nanog. Nuclei with high SNAP-YAP expression are outlined in white. Scale bar: 20 µm. c Sigmoidal curve fit of nuclear Nanog and Oct4 levels as a function of nuclear YAP concentrations reveals differential sensitivity of Oct4 and Nanog to YAP levels through offset repression thresholds (IC50s) that establish three distinct regimes for joint activation of Oct4 and Nanog (low YAP levels), joint repression of Oct4 and Nanog (high YAP levels) and preferential inhibition of Nanog and versus Oct4 (intermediate YAP levels). Dashed lines indicate IC50s. Data was quantified from IF images as representatively shown in b. Shown are mean ± SEM, N = 4 independent experiments, R2 = 0.96 (Oct4), R2 = 0.97 (Nanog). X-axis is clipped, see Supplementary Fig. 4a for full range. d Deletion of the TEAD binding sites in the gene regulatory region of the Oct4 locus reporter affect the sensitivity of the locus to steady-state YAP levels, shifting the Hill coefficient from 1.6 ± 0.2 (WT) to 0.9 ± 0.1 (TEAD mutant). The Oct4 reporter is ectopically introduced and based on the replacement of the Oct4 open reading frame with GFP (d, top). The location of the TEAD binding sites is schematically shown, see Supplementary Fig. 5a for details. Shown are Oct4 reporter levels as a function of nuclear YAP levels and the sigmoidal curve fit from a single experiment. See Supplementary Fig. 5c for replicates. Hill coefficient represents mean ± SEM from N = 3 independent experiments. p value from two-sided unpaired Student’s t test.

