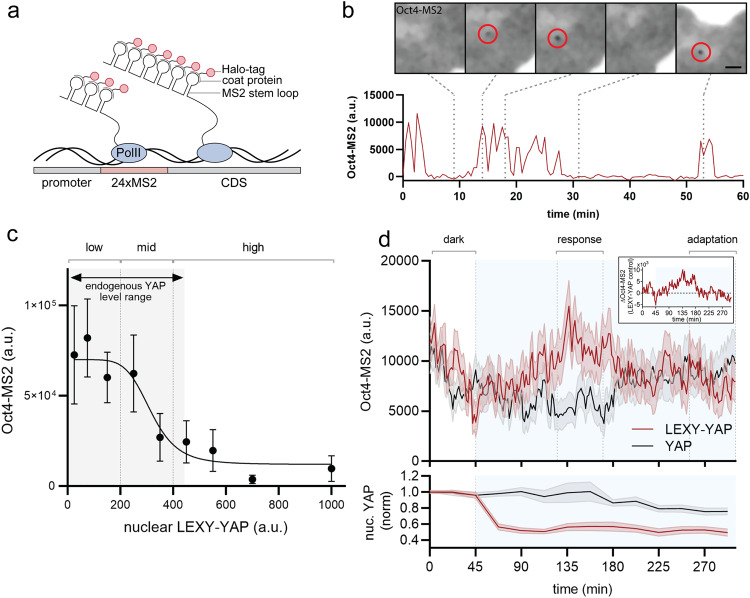
Fig. 4. Oct4 acts as adaptive change sensor of YAP levels.
a MS2 system for visualization of transcription in single living cells. Transcription of the 24xMS2 DNA array generates RNA stem loops that are detected through their recruitment of Halo-tagged coat proteins and visible as fluorescent spots at the transcription site (b). CDS: Coding sequence. b Oct4-MS2 live-imaging reporter in WT mESCs shows transcriptional bursting. Shown are example microscopy data for indicated time points (dashed line) of the time course. Scale bar: 2.5 µm. c Oct4-MS2 signal as a function of steady-state nuclear LEXY-YAP levels reveals that YAP acts as a repressor of Oct4 transcription. Min-max range of endogenous YAP levels measured in WT cells is indicated by gray shading. Shown are mean ± SEM, N = 15 independent experiments. d Top: Oct4-MS2 transcriptional activity upon light-gated nuclear YAP export in LEXY-YAP mESCs (red curve) vs. non-light responsive YAP control cells (gray curve). Difference between mean of LEXY-YAP and YAP curve is shown as inset on the top right, indicative of transient adaptive YAP target activation in response to sustained export of YAP from the nucleus. Bottom: Nuclear YAP levels in LEXY-YAP (red) and YAP (gray) mESCs simultaneously imaged for Oct4-MS2 shown in the top panel. Illumination phase is indicated by blue shading. Shown are mean ± SEM, N = 12 independent experiments.

