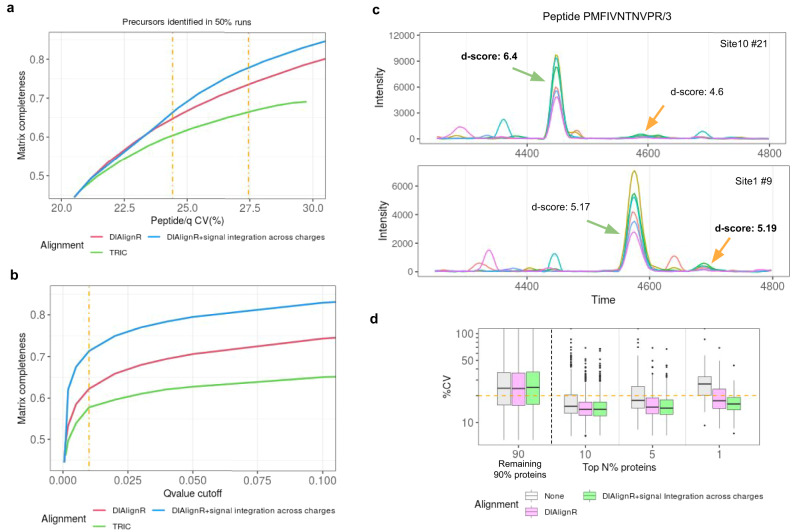
Fig. 3. Comparison of signal alignment by DIAlignR on multisite data.
To measure completeness 54,492 analytes are considered which are quantified in at least half of the runs. a Effect of matrix completeness on CV is presented for TRIC and DIAlignR without and with signal integration across charges (considered for q value > 0.001). Dot-dash line represents 0.01 and 0.05 cut-offs with CV being 24 and 27%. b Effect of PyProphet q value cut-off on matrix completeness. c Example chromatograms for a peptide from two sites with colored lines representing MS/MS signal. Peak selection, which relies on d-score, is inconsistent across both runs. d-score is in boldface for peaks selected by pyProphet. d CV of high intensity proteins (n = 4604) is depicted without and with signal alignment.

