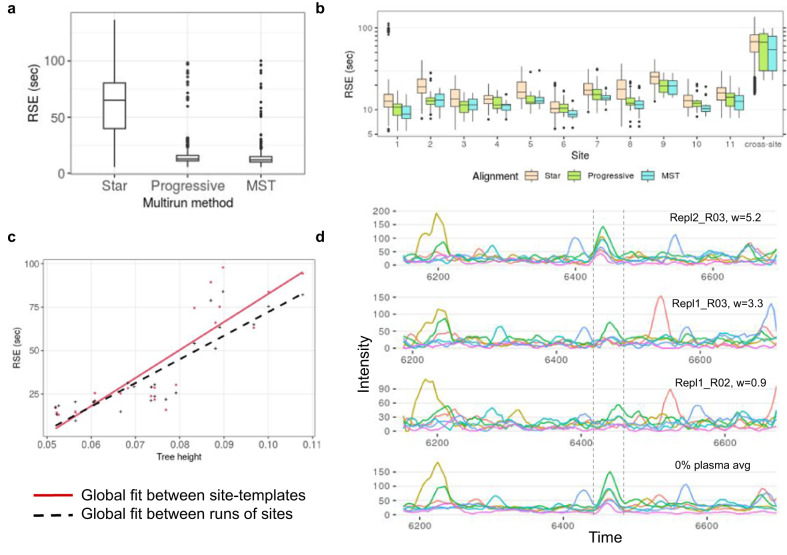
Fig. 4. Comparison of Star, MST and Progressive alignments.
a RSEs of global fits used in the Star, Progressive, and MST alignment of 229 runs. b RSEs of global fits used in the intra-site alignments and cross-site alignments. c Mean RSE from the Progressive alignment of site-specific templates v/s mean RSE of global fits between runs of these sites. d An example of aligned chromatograms of peptide TVASNPQGFFDILMAPVR/3 from S. Pyogenes cell lysate data. The six runs are weighted averaged during progressive alignment to produce a merged chromatogram, shown at the bottom. Only three runs out of six are depicted here. The correct peaks are overlapping the dashed boundary from the merged chromatogram.

