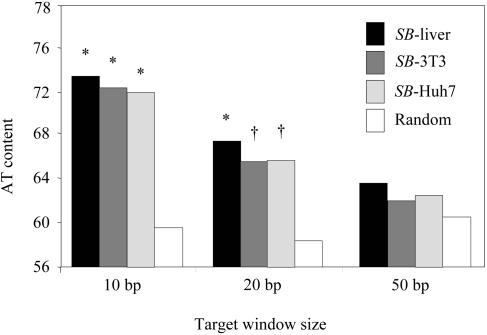
FIG. 4.
Genomic AT contents of SB integrations in three different cell types. The total AT contents of SB insertion sites were analyzed by using variable window sizes and were compared to those of 10,000 random integrations. Significant differences were determined by a χ2 test. *, P < 0.0001; †, P < 0.02.

