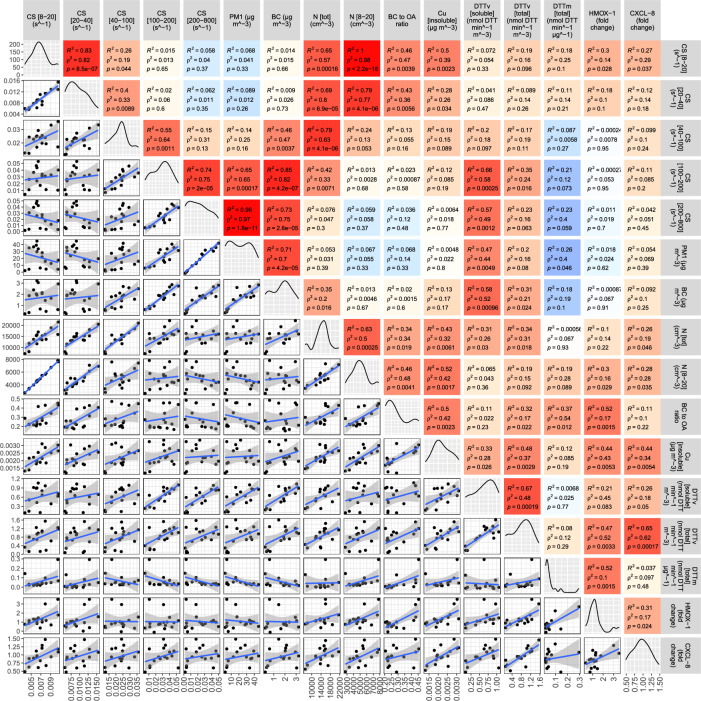
Figure 1.
Statistics for comparison between atmospheric aerosol properties and related pro-inflammatory and oxidative endpoints. Paired scatterplot matrix shows 24-h data for variables related to bulk aerosol (PM1, and BC mass concentration, and total number concentration, N); the Condensation Sink (CS) as a function of particle size, in the nucleation, Aitken, soot, condensation and larger accumulation mode (CS, CS,CS, CS, CS, see “Method” Section); aerosol type (number concentration of nucleation mode particles, N, BC-to-OA ratio, and insoluble Copper mass concentration (Cu)); both water-soluble and total aerosol oxidative potential (DTT activity of PM samples); gene expression for oxidative stress (fold change for HMOX-1 and inflammation (fold change for CXCL-8). Statistical correlation values is shown in the box as Pearson correlation (R), and Spearman correlation (), with the relative significance level (p-value). The color gradient is proportional to the Pearson correlation coefficient, R (red for positive R, blue for negative R). The number of points (n) to calculate correlations is 16, except for DCFH where n = 8. Created in R-Studio version 2022.12.0 using ggpairs function from the GGally package version 2.1.2.

