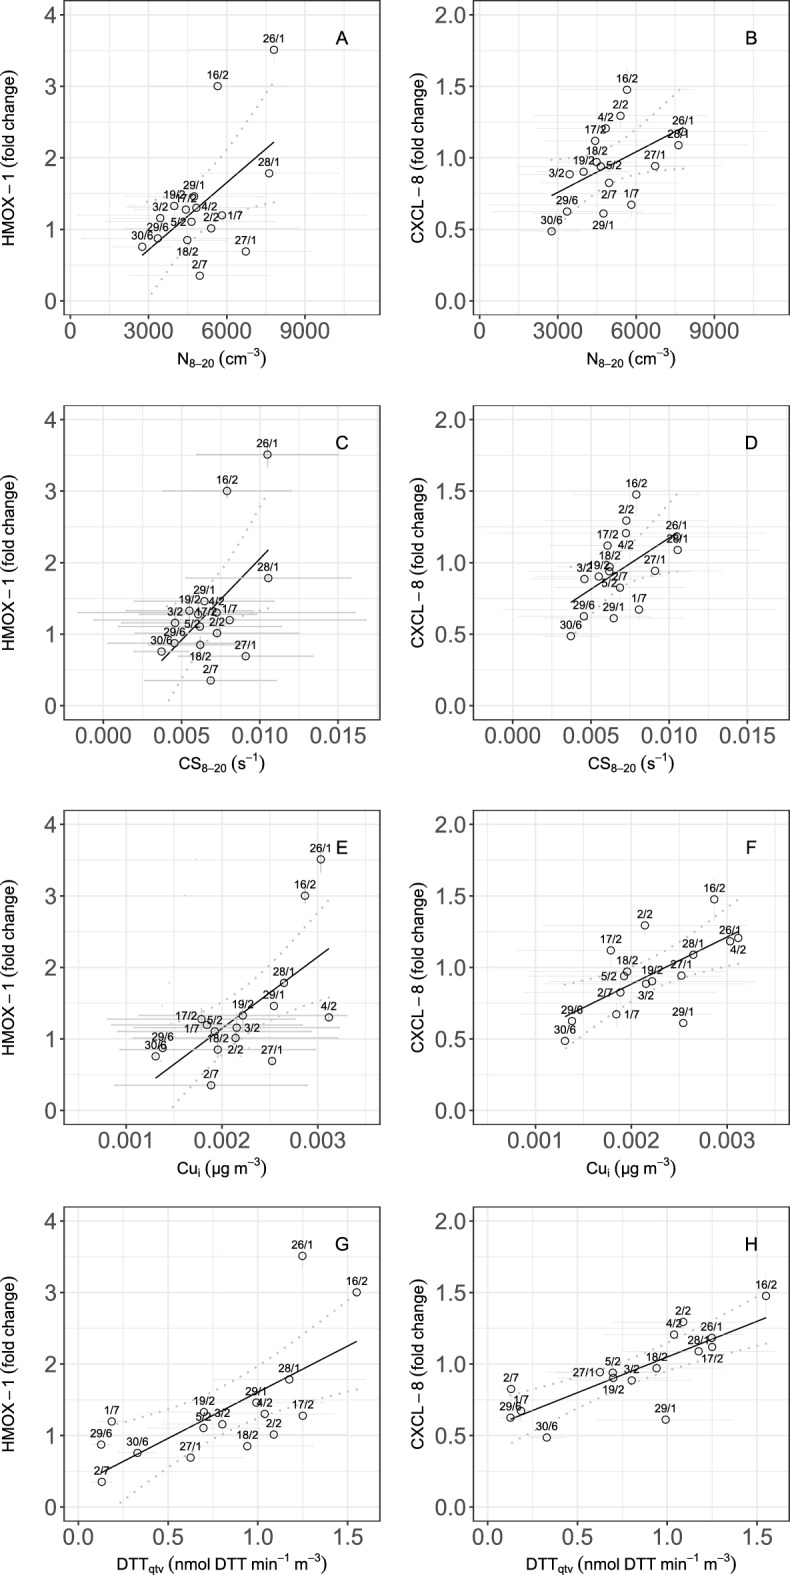
Figure 2.

Relationships between atmospheric aerosol properties and oxidative capacity, and pro-inflammatory and oxidative markers. The number concentration of nanoparticles N (panels A, B), Condensation Sink of nanoparticles CS (panels C, D), insoluble Copper (Cu) mass concentration (panels E, F), and (G, H) total oxidative potential (DTT activity of PM samples) is presented against the fold change (f.c.) in gene expression for HMOX-1 (oxidative stress) and CXCL-8 (inflammation). Data points are indicated with standard deviation error bars. Linear regression lines are indicated with a 95% confidence interval (dashed ribbons), and relevant date of measurements (dd/m).
