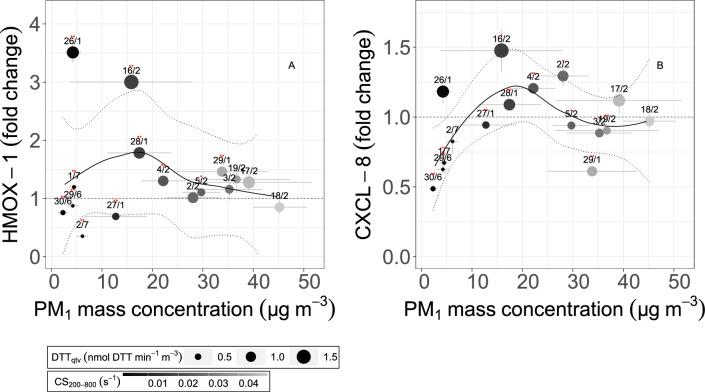
Figure 5.
Concentration-response curves for PM mass concentration versus pro-oxidative and inflammation biomarkers. Gene expression patterns for HMOX-1 (indicative of oxidative stress, panel A) and CXCL-8 (indicative of inflammation, panel B) are indicated against PM1 mass concentration (x-axis). Data points are colored by the condensation sink, and sized by the aerosol Oxidative Potential (total DTT activity in PM1). The fitted regression lines are indicated with a 95% confidence interval (dashed ribbons). Data points are indicated with measurement date (dd/m), standard deviation error bars, and significance level of the biomarkers (** indicate p-value < 0.01, * indicates p-value < 0.05).

