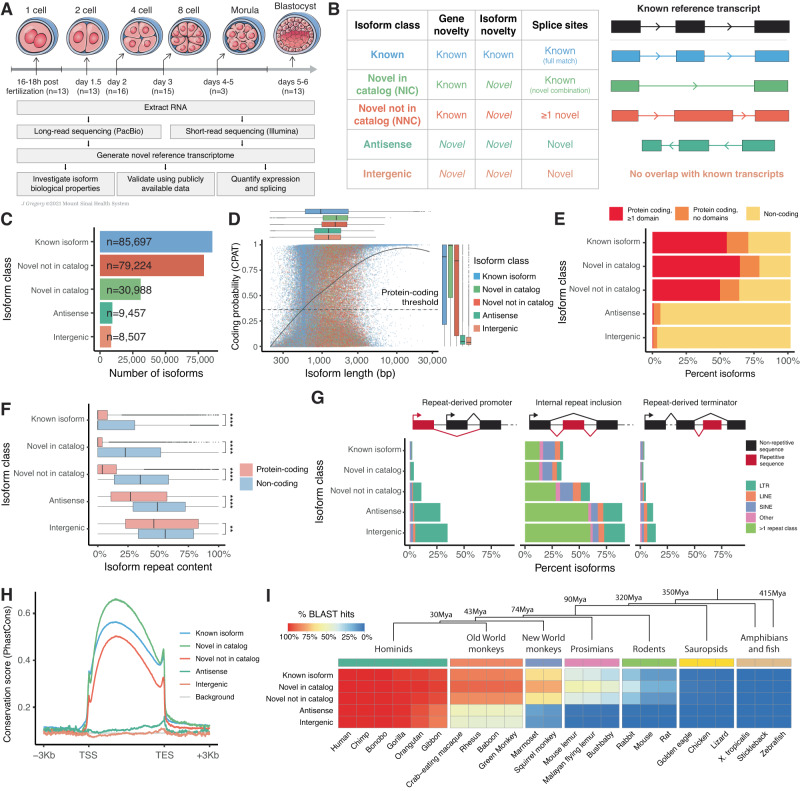
Fig. 1. Generation and functional characterization of the isoform-resolved human embryo transcriptome.
A Overview of the embryonic developmental stages and the sequencing approach (illustration by Jill Gregory). B Schematic representation of the isoform structural classes defined from long-read RNA-Seq data. C Number of isoforms in the novel human embryo transcriptome for each structural class. D Scatter plot displaying isoform length and predicted coding probability for each isoform, colored by isoform class. Residual boxplots display the distributions of isoform length and coding probability along the X and Y axes respectively. E Bar plot displaying the percentage of isoforms in each class based on their predicted protein-coding status, and the presence of known protein domains in the encoded peptide. F Box plots displaying the relative repeat content of isoforms in each structural class, grouped by predicted protein-coding status. For known isoforms, n = 59,517 protein-coding and n = 26,180 non-coding; novel in catalog, n = 24,018 protein-coding and n = 6970 non-coding; novel not in catalog, n = 49,826 protein-coding and n = 29,398 non-coding; antisense, n = 550 protein-coding and n = 8907 non-coding; intergenic, n = 289 protein-coding and n = 8218 non-coding. p < 2x10¹⁶ for known, novel in catalog, novel not in catalong and antisense isoforms, p = 0.0062 for intergenic isoforms. P-values were calculated using unpaired two-sided Wilcoxon Rank Sum test, Benjamini-Hochberg correction. G Bar plots displaying the relative abundance of repetitive elements acting as alternative promoters, internal exon elements, or terminators for each isoform class, grouped by repeat class. H Average base-wise conservation scores (PhastCons100way) across exons and ±3 kb of each isoform, grouped by isoform class. I Evolutionary conservation of transcripts across multiple vertebrates, in relation to the phylogenetic tree. The heatmap displays the percentage of conserved isoforms in each structural class compared to different vertebrate genomes, determined using BLAST. The phylogenetic tree displays evolutionary divergence of selected vertebrate groups from hominids. For the box plot in F, box limits extend from the 25th to 75th percentile, while the middle line represents the median. Whiskers extend to the largest value no further than 1.5 times the inter-quartile range (IQR) from each box hinge. Points beyond the whiskers are outliers. Source data are provided as a Source Data file.

