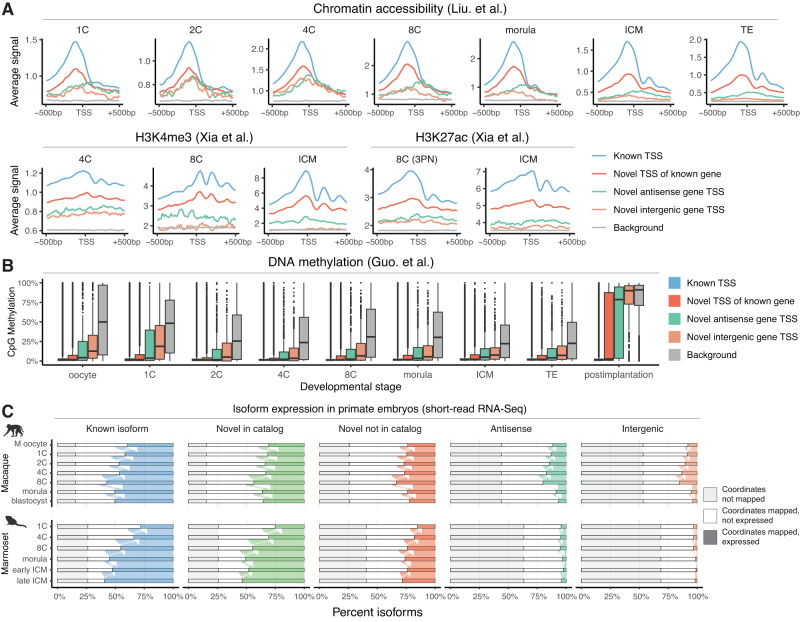
Fig. 3. Novel isoforms are supported by orthogonal epigenomic and non-human primate embryo transcriptomic data.
A Integration of public datasets with the newly identified transcriptome demonstrate epigenetic marks for active transcription across developmental stages. Data are normalized ATAC-Seq and CUT&RUN signal within ±500 bp of TSSs (n = 78,217 known TSSs, 21,016 novel TSSs of known genes, 3589 novel antisense gene TSSs, 3814 novel intergenic gene TSSs, 106,636 background sequences). B Distribution of CpG methylation at TSSs from the novel transcriptome across developmental stages (percentages within ±500 bp of each site, TSSs defined in A). C Percentage of isoforms in each class, grouped according to their mapping status to the macaque and marmoset genomes and their expression in corresponding preimplantation short-read RNA-Seq datasets. For the box plot in B, box limits extend from the 25th to 75th percentile, while the middle line represents the median. Whiskers extend to the largest value no further than 1.5 times the inter-quartile range (IQR) from each box hinge. Points beyond the whiskers are outliers. Icons in C were created with BioRender.com. Source data are provided as a Source Data file.

