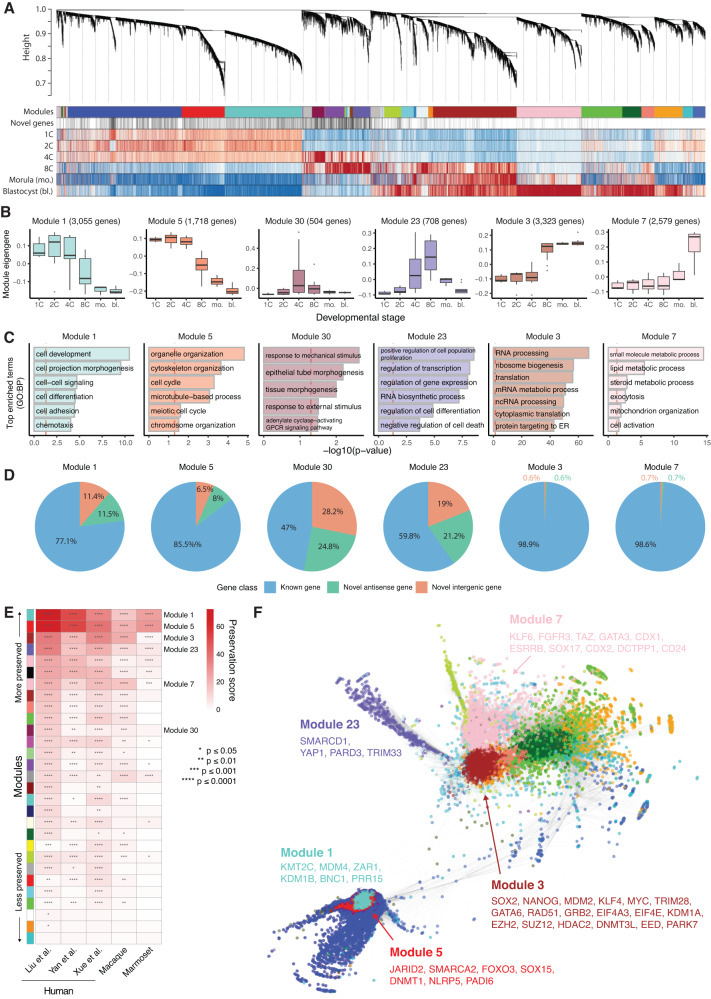
Fig. 6. Novel genes are key components of early expressed, evolutionarily conserved modules of co-expressed developmental genes.
A Hierarchical clustering tree displaying results of the gene co-expression network analysis. Modules of genes co-expressed across developmental stages are displayed as color bars. Novel genes are highlighted below. Normalized gene expression across stages is also displayed (red - highest relative expression, blue - lowest expression). B Representative expression profiles (module eigengenes) of selected gene modules characterizing specific developmental stages (sample sizes for each stage shown in Fig. 1A). C Gene Ontology: Biological Process terms enriched in the selected gene modules shown in B. D Percentage of each gene class in the selected modules. E Heatmap of module preservation scores in independent, publicly available short-read RNA-Seq datasets of human and non-human primate embryos (scores and p-values calculated using the WGCNA modulePreservation function, p-values adjusted using Bonferroni method). Module colors (from A) are shown on the left. F Network diagram displaying connected genes from different modules (represented as different colors, from A) of the gene co-expression network. A selection of known developmental genes is highlighted for five modules. For the box plot in B, box limits extend from the 25th to 75th percentile, while the middle line represents the median. Whiskers extend to the largest value no further than 1.5 times the inter-quartile range (IQR) from each box hinge. Points beyond the whiskers are outliers. Source data are provided as a Source Data file.

