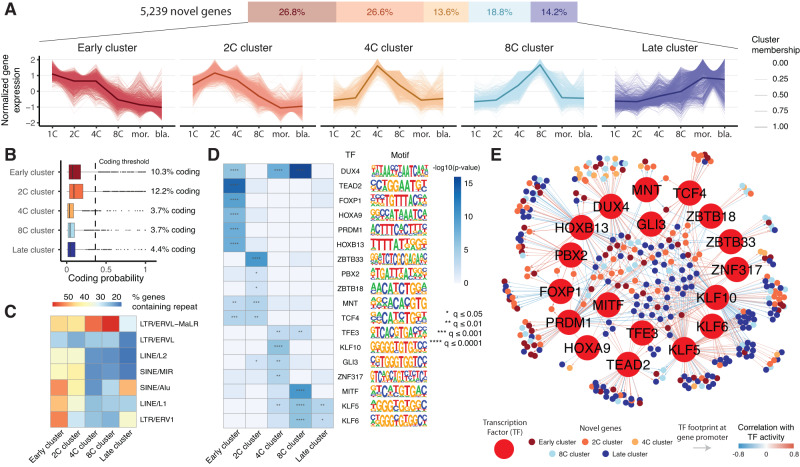
Fig. 7. Novel genes have distinct expression patterns, predicted biological properties, and transcriptional regulators.
A Novel genes separate into five clusters with distinct expression patterns across human preimplantation development (n = 1402 genes in early cluster, 1391 genes in 2C cluster, 712 genes in 4C cluster, 987 genes in 8C cluster, 746 genes in late cluster). B Predicted coding probability for novel genes in each cluster defined in A. C Heatmap displaying the percentage of novel genes in each cluster containing distinct classes of human retrotransposons. D Heatmap displaying predicted transcription factor regulators of each novel gene cluster, including their DNA binding motifs (p-values calculated using HOMER findMotifsGenome.pl, q-values adjusted using Benjamini-Hochberg method). E Network diagram displaying predicted TFs-novel target gene pairs, as determined by integration of ATAC-Seq footprinting and inferred TF activity-gene expression correlation. For the box plot in B, box limits extend from the 25th to 75th percentile, while the middle line represents the median. Whiskers extend to the largest value no further than 1.5 times the inter-quartile range (IQR) from each box hinge. Points beyond the whiskers are outliers. Source data are provided as a Source Data file.

